
Gold prices bounce around in typical volatile year-end trading on Friday, hovering near monthly tops of $1,820. According to market analyst Anil Panchal, gold almost tested December highs, but failed to break it as the bulls continued to be cautious towards the annual close. Market analyst Jim Wyckoff notes that gold prices rose to US trading around noon on Thursday as bullish traders stepped in to buy the early dip in prices and do some bargain hunting. Market reviews and technical analysis by Anil Panchal and Jim Wyckoff Cryptocoin. com we have compiled it for its readers.
“Mixed moves of risk catalysts lead traders to traditional port”
The bright metal is on track to post its worst performance in six years as the US dollar holds high amid expectations for aggressive Fed tightening next year. According to analyst Anil Panchal, the lack of key catalysts and weak year-end liquidity conditions are pushing gold prices, while the recent downside US dollar performance and mixed movements of other risk catalysts are leading traders to traditional harbor.
The precious metal rallied on Thursday despite the US Dollar Index rebounding on stronger data. The analyst states that the reason for this may be related to the indecision about the Fed’s next move due to Omicron and the escalation of geopolitical tensions.
Analyst Anil Panchal says that gold prices passed the 200-SMA at $1,801 after breaking the two-week support, now the resistance is located around $1,820,. However, the decreasing bearish bias of the MACD and the stable RSI are helping the metal buyers to remain hopeful, and in addition to the 200-SMA, the 100-SMA’s repeated bounce near $1,793 is also supporting the golden bulls. Stating that the same situation indicates that the recovery is gaining momentum, the analyst draws the following resistance levels:
However, gold buyers are waiting for a clear upside break to $1,820. This will lead the metal to the November-December downside 61.8% Fibonacci retracement level, i.e. $1,830.
However, bullion’s upward move will only be a stumbling block, according to the analyst. So there will be a 78.6% Fibonacci level around $1,851 before challenging the last monthly high around $1,877. Anil Panchal concludes his technical analysis by identifying support points:
Meanwhile, a downside break to $1,792 will trigger a drop to $1,770. However, a two-month horizontal support zone near $1,760, looks like a tough nut to crack for the golden bears.
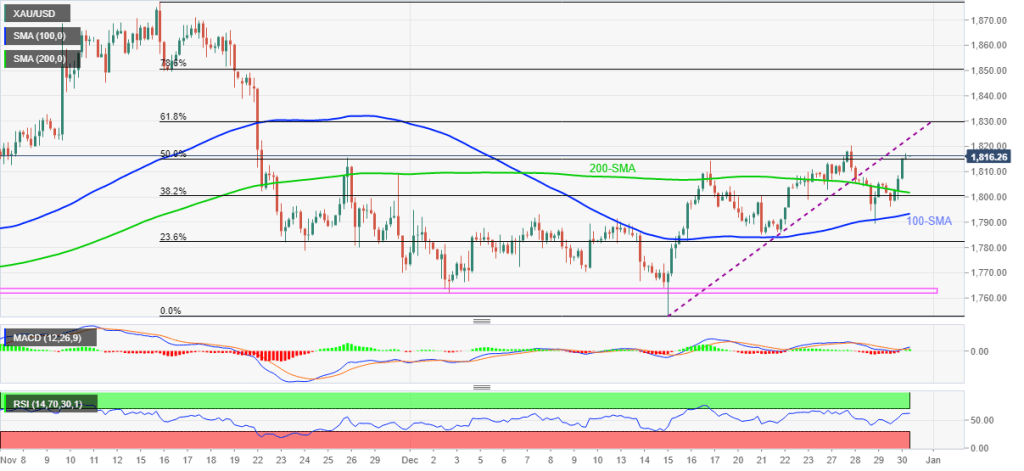 Gold prices 4-hour chart / Source: Fxstreet
Jim Wyckoff: JP Morgan is wrong, gold prices will be higher
Market analyst Jim Wyckoff notes that gold prices rose to US trading around noon on Thursday as bullish traders stepped in to buy the early dip in prices and do some bargain hunting. Investment bank JP Morgan forecasts gold prices at $1,520 in the fourth quarter of 2022.
According to the analyst, the commodity market forecasts of these major banks are often wrong. The analyst takes the other side of JP Morgan’s forecasts and predicts that gold prices will be higher than current levels in the 4th quarter of 2022. He attributes the reason that price inflation will become much more problematic in 2022 and that the Federal Reserve cannot do much about it. The analyst states that this scenario could be bad news for paper assets like stocks and bonds, and good news for fixed assets like precious metals.
Analyst Jim Wyckoff says that technically, February gold bulls have a short-term technical advantage overall and the next upside price target for the bulls is to produce a close above solid resistance at $1,840.00. According to the analyst, the bears’ next short-term downside price target is to push futures prices below solid technical support at $1,775.00. The analyst points to the following technical levels:
Initial resistance is seen at $1,815.70 followed by this week’s high at $1,821.30. Initial support is seen at $1,800 followed by this week’s low at $1,789.10.


