 Price Analysis: Consolidating, What Next?")
Bitcoin continues its recovery efforts. Although it started an upside correction above $60,000, it is trading again at $59,000 as of broadcast time. According to technical analysis by NewsBTC’s Aayush Jindal, BTC could rally more but the bears may remain active around $62,500:
- Bitcoin is still trading well below the $62,000 and $62,500 resistance levels.
- Price is currently trading below $62,000 and the 100 hourly simple moving average.
- There is a major bearish trend line forming with resistance near $60,700 on the hourly chart of the BTC/USD pair (data from Kraken).
- The pair could recover towards $62,500, where the bears could take a stand.
Bitcoin Turns Red
Bitcoin continued its decline and bottomed at $58,630. There was a minor recovery wave above the $59.500 and $60,000 levels. The main drop from $66,350 to $58,630 is 23%. There was a break above the 6 Fib retracement level.
An immediate upside resistance is near the $60,700 level. There is also a major bearish trend line forming with resistance near $60,700 on the hourly chart of the BTC/USD pair. A close above the $60.700 level could set the tone for a bigger increase. The first major resistance is near the $62,500 level. This is near the 50% Fib retracement level of the main decline from the $66,350 high to $58,630 high.
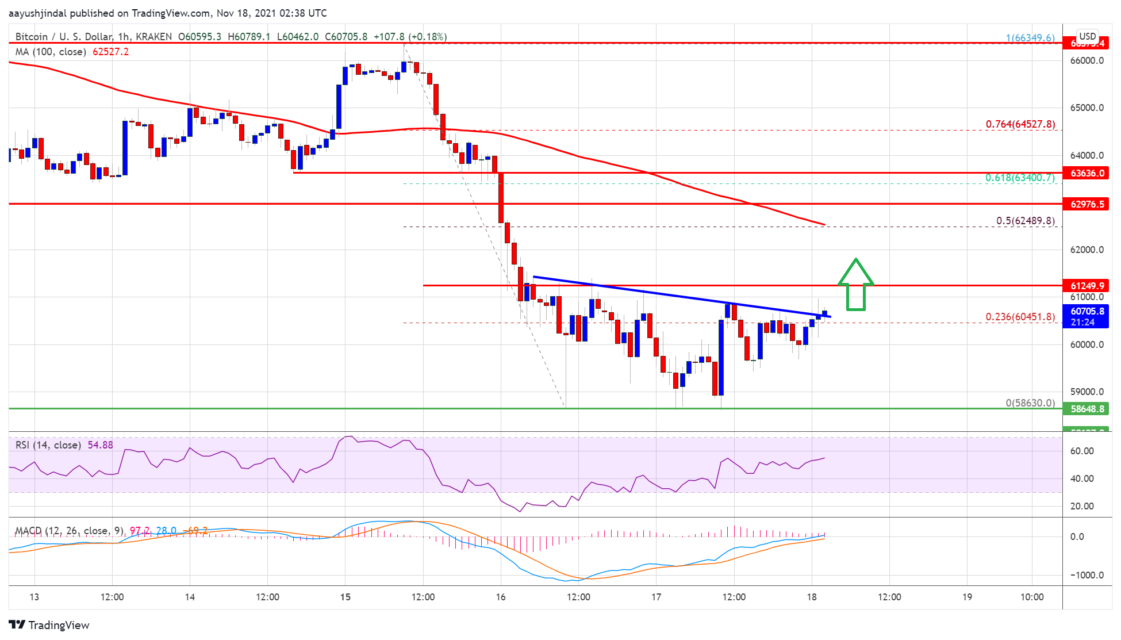
If the bulls push the price towards $62,500, the bears are likely to take a stand. Any further gains could open the doors for a move towards the $63,200 level.
Will Bitcoin Drop More?
According to Jindal, if Bitcoin fails to break above the $61,200 resistance zone, it could continue its decline. An immediate support on the downside is near the $59,500 level. The first major support is now formed near the $59.200 level. The next major support is near the $58,500 level, below which the bears could aim more declines. In the stated case, the price could slide towards the $55,000 support zone in the near term.
What Do Technical Indicators Say?
- Hourly MACD – The MACD is now losing momentum in the bearish zone.
- Hourly RSI (Relative Strength Index) – The RSI for BTC/USD is now just above the 50 level.
- Main Support Levels – 59.200 then $58.500
- Main Resistance Levels – $60.700, 61.200 and $62.500


? Flare Token Price and Comment")

