 Price Analysis: Launches Good Recovery, What’s Next?")
Bitcoin started a sharp recovery wave at $39,700. BTC is rising and the bulls’ next big stop could be $43,500, according to technical analysis by NewsBTCDen Aayush Jindal.
Bitcoin Rebounds Strongly
Bitcoin yesterday dropped below the $40,000 level for the first time since September and slumped as low as $39,659. Then, there was a sharp recovery wave above the $40,000 level. BTC climbed above the $40,500 and $41,200 resistance levels. The bulls, on the other hand, pushed the price above the 50% Fib retracement level of the recent decline from the $42,739 high to $39,659 low.
There was also a break above a key bearish trend line with resistance near $41,800 on the hourly chart of the BTC/USD pair. Bitcoin is currently trading above $42,000 and the 100 hourly simple moving average.
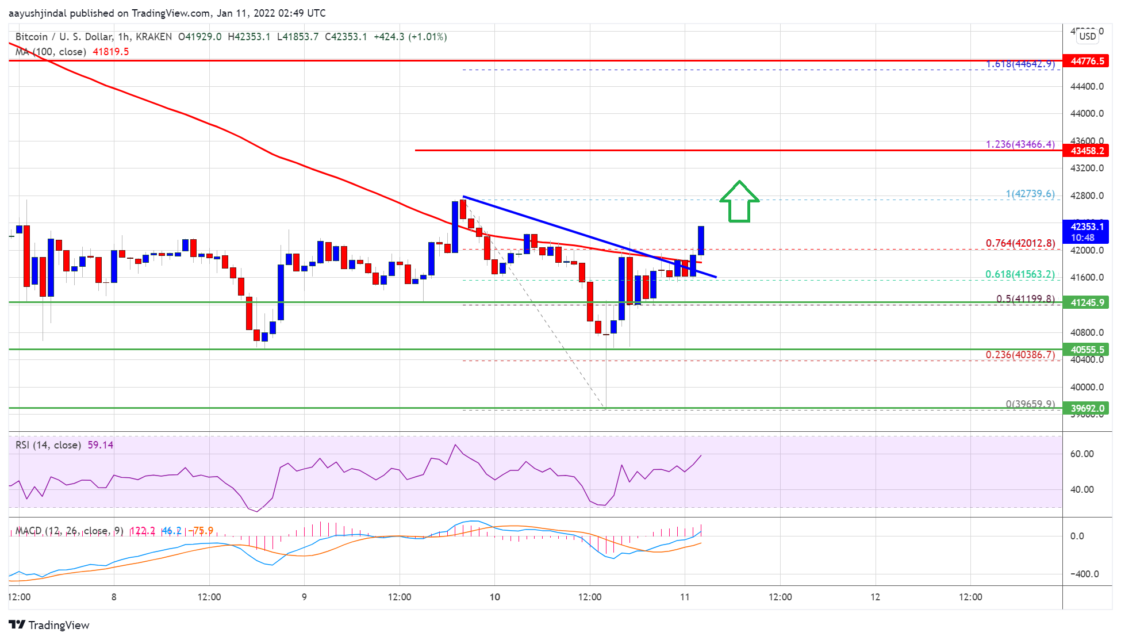
The first major resistance is near the $42.750 level. The next major resistance is near the $43,500 level. This is close to the 1.236 Fib extension level of the drop from the $42,739 high to $39,659 low. Any further gains could lead the price towards the $44,500 level. The next major resistance is near the $45,500 level, where the bears could emerge.
Will Bitcoin Drop More?
Jindal says that if Bitcoin fails to rise above $43,500, it could start a fresh decline. An immediate support is near the $41,800 zone and the 100 hourly SMA. The first major support is near the trendline and $41,500. A downside break below the trendline support could lead the price towards the $41,000 level. Any more losses could push the price towards the $40,000 support zone.
What Do Technical Indicators Say?
- Hourly MACD – The MACD is now gaining momentum in the bullish zone.
- Hourly RSI (Relative Strength Index) – The RSI for BTC/USD is now above the 50 level.
- Main Support Levels – 41.500 then $40.500
- Main Resistance Levels – $42.750, $43,000 and $43,500


? Flare Token Price and Comment")

