 Price Analysis: Possibility of More Drops Strengthening?")
The risk continues in Bitcoin. According to technical analysis by NewsBTC’s Aayush Jindal, if BTC continues to stay below the $43,000 pivot zone, it could continue to decline.
Bitcoin Continues Its Fall
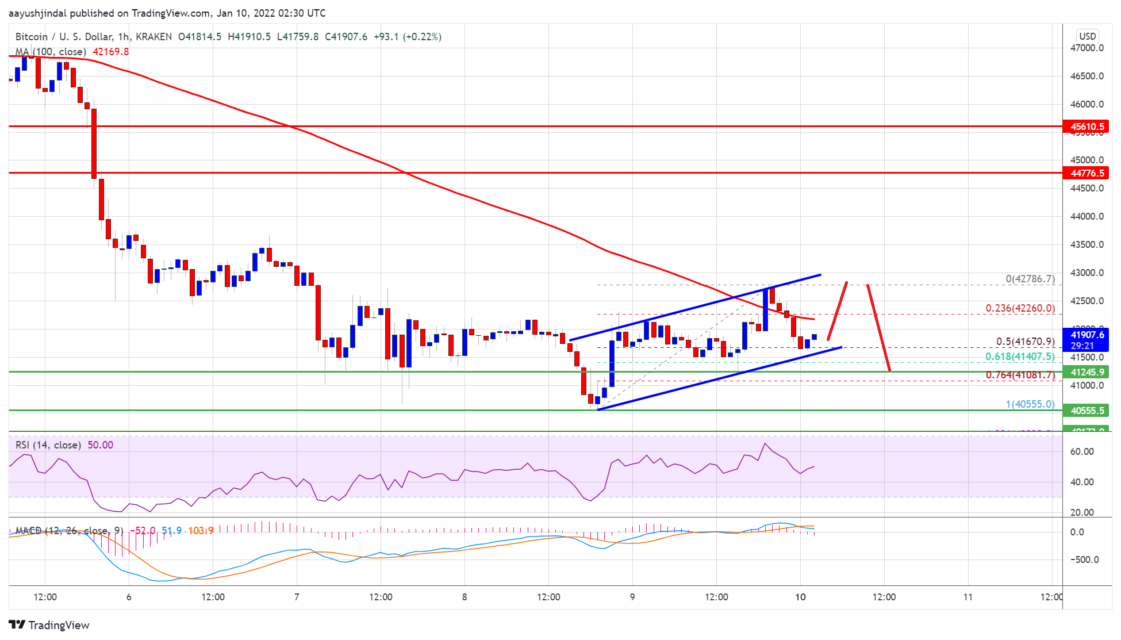
Bitcoin weekend extended its decline below the $42,000 support zone. The bears have attempted a push towards $40,000. A local bottom was formed near $40,555 and there was a recovery above the $42,000 level and the 100 hourly simple moving average before a recovery wave occurred.
On the other hand, the bears remained active near the $42,800 zone. A local top was formed near $42,786 and the price is currently declining. It is 23% of the recent move from the low of $40,555 to the top of $42,786. There was a move below the 6 Fib retracement level.
BTC is currently trading near the $41,750 support. The 50% Fib retracement level of the recent wave from the $40,555 high to $42.786 high is also near the $41,650 area.
There is also a key ascending channel forming with support near $41,650 on the hourly chart of the BTC/USD pair. The first major resistance is near the $42.250 level and the 100 hourly SMA. The next major resistance is near the $43,000 level.
43. $ 000 Level Matters
A clear move above the $43,000 resistance zone could start a decent recovery wave. The next major resistance is near the $44,500 level.
Will Bitcoin Drop More?
Jindal says that if Bitcoin fails to rise above $43,000, it may continue to move down. According to him, an immediate support is near the $41,800 zone. The first major support is near $41,650 and the channel trend line. A downside break below the trendline support could trigger a move below $41,000. In the stated case, the price could decline to the $40,000 level in the near term.
What Do Technical Indicators Say?
- Hourly MACD – The MACD is now gaining momentum in the bearish zone.
- Hourly RSI (Relative Strength Index) – The RSI for BTC/USD is now close to the 50 level.
- Main Support Levels – 41. 650 then $40,000
- Main Resistance Levels – $42.750, $43,000 and $44,500


? Flare Token Price and Comment")

