 Price Analysis: Showing Negative Signals, What Are the Key Levels?")
Bitcoin continues to struggle. BTC failed to break the $58,500 resistance and started to decline. According to technical analysis by NewsBTC’s Aayush Jindal, it could gain momentum below the $56,000 support in the short term.
Bitcoin Struggles
Bitcoin failed to gain momentum above the $58,500 resistance zone and there was a break below the $58,000 level. BTC is 23% of the upward move from $53,300 to $58,890. It traded below the 6 Fib retracement level. There was also a break below a key bullish trend line with support near $57,200 on the hourly chart of the BTC/USD pair.
An immediate resistance on the upside is near the $57,500 level. The first major resistance is near the $58,000 level. The main resistance is still near the $58,500 level. A clear break above the $58.500 resistance zone could open the doors for more upsides. The next key resistance is near the $60,000 level, where the price could rise steadily. The bulls’ next stop is likely near the $61,200 level.
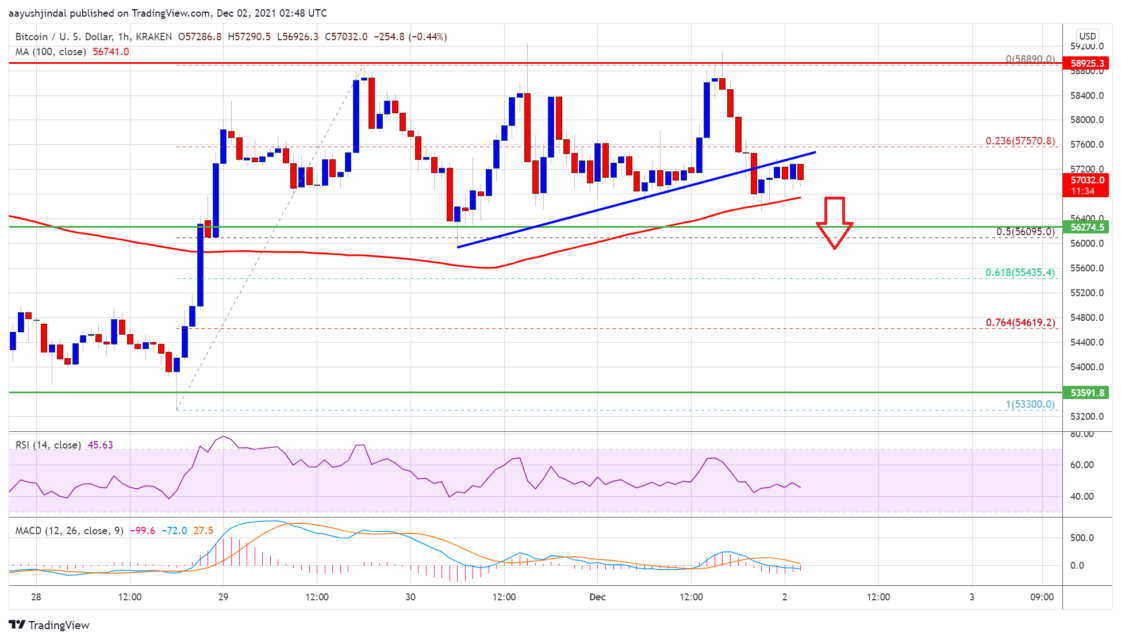
Will Bitcoin Drop?
Jindal says that if Bitcoin fails to break past the $58,000 resistance zone, it could start a fresh decline. An immediate support on the downside is near the $57,000 level. The first major support is currently forming near the $56,800 level and the 100 hourly SMA.
The next major support is near the $56,000 level. This is close to the 50% Fib retracement level of the upward move from the $53,300 high to $58,890 high. A downside break below the $56,000 support could push the price towards $55,000. Any more losses could start a massive decline towards $52,000.
What Do Technical Indicators Say?
- Hourly MACD – The MACD is now gaining momentum in the bearish zone.
- Hourly RSI (Relative Strength Index) – The RSI for BTC/USD is currently below the 50 level.
- Main Support Levels – $57,000 followed by $56,000
- Main Resistance Levels – $58,000, $58,500 and $60,000


? Flare Token Price and Comment")

