 Price Analysis: Stays in an Uptrend, What are the Key Levels?")
Bitcoin sparked joy in the community by setting a new ATH yesterday. BTC, which also broke the key $65,000 resistance level, is currently correcting. According to technical analysis by NewsBTC’s Aayush Jindal, dips may be limited around $63,000:
- Bitcoin gained momentum above the $65,000 and $65,500 resistance levels.
- Price is currently trading above $63,000 and the 100 hourly simple moving average.
- There is a key bullish trend line forming with support near $63,000 on the hourly chart of the BTC/USD pair (data from Kraken).
- The pair is correcting gains but declines may be limited below $62,000 in the near term.
Bitcoin Stays in Uptrend
Bitcoin set a new ATH yesterday, extending its gain above the $63,500 resistance zone. BTC broke the key $65,000 resistance area and settled above the 100 hourly simple moving average. It even climbed above the $65,500 resistance and traded at the all-time high of $66,982. It is currently correcting lower and trading below the $66,000 level. 23% of the surge from $61,320 to $66,982. There was a break below the 6 Fib retracement level. According to Jindal, an immediate support is near the $64,200 level. There is also a key bullish trend line forming with support near $63,000 on the hourly chart of the BTC/USD pair.
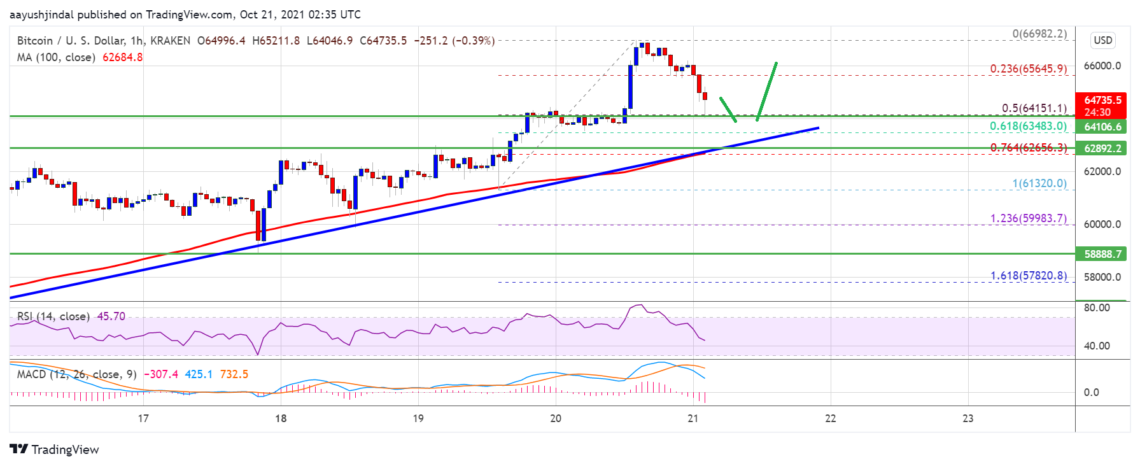
Initial resistance on the upside is near the $65.200 level. The first key resistance is near the $65,500 level. A clear break above the $65.500 resistance could open the doors for more upsides. The next major resistance is near the $66,800 level, above which the price could rise towards the $68,000 level. Any further gains could lead the price towards the $68,000 level.
Will Bitcoin Drop?
Jindal says that if Bitcoin fails to break through the $65,500 resistance zone, it may continue its downside correction. An immediate support on the downside is near the $64,200 level. The first major support is currently forming near the $64.150 level. This is near the 50% Fib retracement level of the bullish wave from the $61,320 high to $66,982 high. The main support is near the trend line and $63,400, below which the price could decline towards the $63,000 support and the 100 hourly SMA.
What Do Technical Indicators Say?
- Hourly MACD – The MACD is now losing momentum in the bullish zone.
- Hourly RSI (Relative Strength Index) – The RSI for BTC/USD is now below the 50 level.
- Main Support Levels – 64.150 then $63.400
- Main Resistance Levels – $65.500, $66.800 and $68,000


