
Crypto analyst Rakesh Upadhyay states that Bitcoin (BTC) continues to face resistance around $60,000, but this does not stop altcoins from advancing to their previous all-time highs. The analyst examines the charts of the top 10 cryptocurrencies to see if the bulls can sustain the current momentum after starting December on a strong footing. we too Cryptocoin. com we have compiled Rakesh Upadhyay’s analysis for our readers.
An overview of the cryptocurrency market
Bitcoin (BTC) closed the month of November with a decrease of about 7%. This was the opposite of PlanB’s $98,000 “worst-case scenario” prediction of the creator of the popular stock-to-flow model. While the analyst described this as a “major shortcoming,” he said it would give the base model another month.
In its latest “weekly on-chain” report, Glassnode analysts say Bitcoin’s November correction is “the lowest severity in 2021.” Analysts are now expecting Bitcoin to witness a Santa Claus rally similar to the 47% increase in December 2020 or the sharp 80% increase that occurred in December 2017.
 Daily cryptocurrency market performance / Source: Coin360
Another positive piece of news for bitcoin bulls came from Bloomberg senior exchange-traded fund (ETF) analyst Eric Balchunas. The analyst said that the Fidelity Advantage Bitcoin ETF is awaiting regulatory approval to be listed on the Canadian stock exchange. If that happens, Fidelity will be the largest management company to offer a spot-based Bitcoin ETF.
BTC, ETH, BNB, SOL and ADA analysis
Bitcoin (BTC)
Crypto analyst Rakesh Upadhyay states that Bitcoin has been holding on to the 20-day exponential moving average (EMA) ($58,463) for the past two days, showing that the bears are defending the 20-day EMA, but the bulls are not leaving much ground.
 BTC daily chart / Source: TradingView
According to the analyst, buyers are trying to push the price back above the 20-day EMA as of December 1, if they are successful, it will show that selling pressure may ease and BTC could then rise to the 50-day simple moving average (SMA) ($60,828). The analyst draws attention to the following technical levels:
This is a critical level for the bears to defend as a break above this will clear the way for a rally towards a top resistance zone between $67,000 and $69,000.
The analyst says the reverse will indicate that traders are selling in rallies if the price does not fall from the current level or the 50-day SMA, and concludes his analysis as follows:
BTC could then drop back to the 100-day SMA ($54,343). A break and close below $53.56.64 could start a deeper correction.
Ethereum (ETH)
The analyst states that Ethereum (ETH) has broken and closed above the resistance at $4,551 on November 30, and says that the continued buying on December 1 brought the price closer to its all-time high of $4,868.
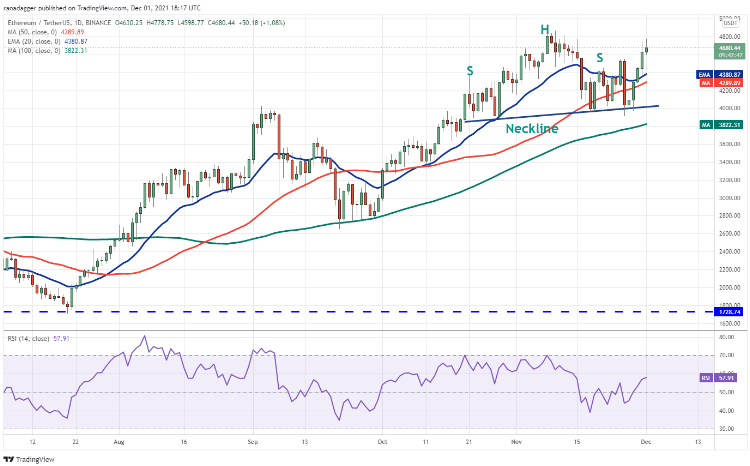 ETH daily chart / Source: TradingView
According to the analyst, the 20-day EMA ($4,380) has started to rise and the relative strength index (RSI) has moved into positive territory, indicating that the bulls are back in control. The analyst thinks that if the bulls push the price above $4,868, it will invalidate the possible head and shoulders (H&S) pattern. In the continuation of his analysis, he points to the following levels:
ETH could then begin its northward march towards the target target at $5,796. Conversely, if the price declines from overhead resistance, the bears will attempt to push the pair below the 50-day SMA ($4,289). If they do, ETH could drop to $4,000.
Binance Coin (BNB)
The analyst states that Binance Coin (BNB) once again bounced off the 20-day EMA ($602) on Nov. 30, showing that the sentiment is positive and traders are piling up on the dips.
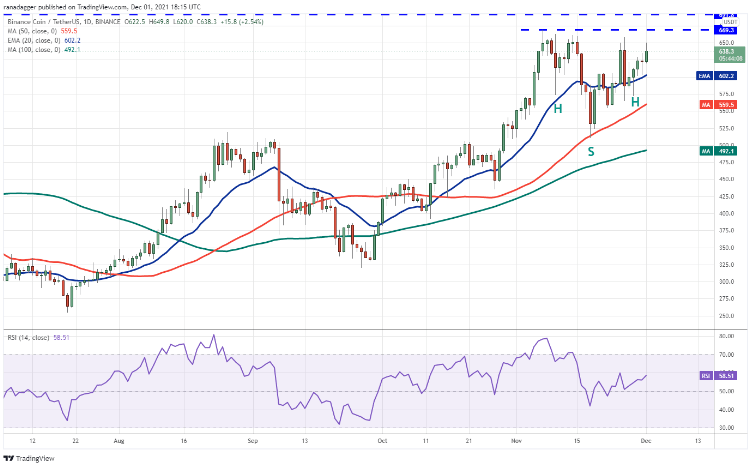 BNB daily chart / Source: TradingView
Left (LEFT)
According to the analyst, Solana (SOL) rose above the 20-day EMA ($213) on November 30, but the long wick on the candlestick showed selling at higher levels. The analyst says that the bulls continued their purchases on December 1 and pushed the price to the resistance line of the symmetrical triangle.
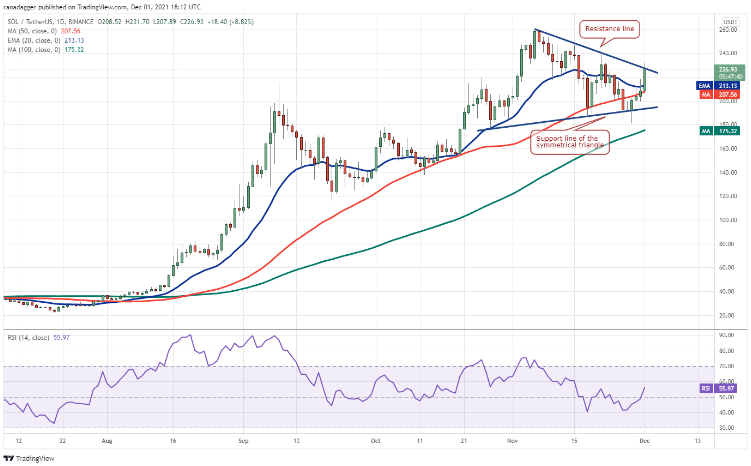 SOL daily chart / Source: TradingView
Cardano (ADA)
The analyst states that Cardano (ADA) turned bearish on November 30, but the bulls bought this drop and tried to continue the aid rally on December 1. If buyers push the price above $1.63, the recovery could reach the 20-day EMA ($1.74), where the bears could try to pose a tough challenge again.
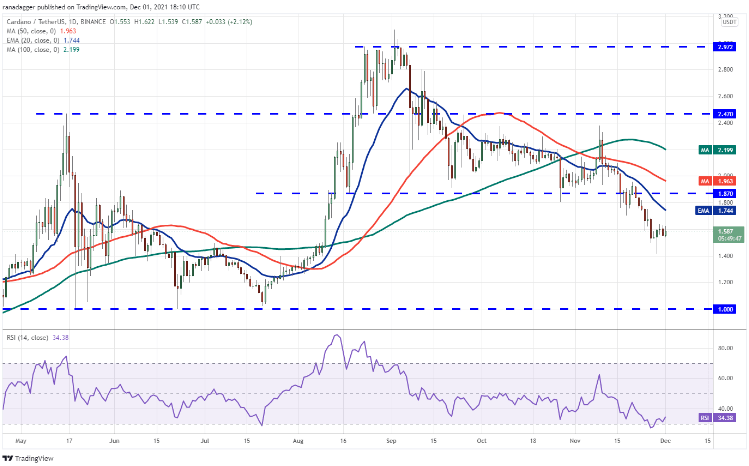 ADA daily chart / Source: TradingView
XRP, DOT, DOGE, AVAX and SHIB analysis
Ripple (XRP)
The analyst notes that Ripple (XRP) rebounding from strong support at $0.85 is facing resistance at the 20-day EMA ($1.04) as seen from the long wick on the November 30 candlestick. A minor positive is that the bulls are not leaving much ground, according to the analyst.
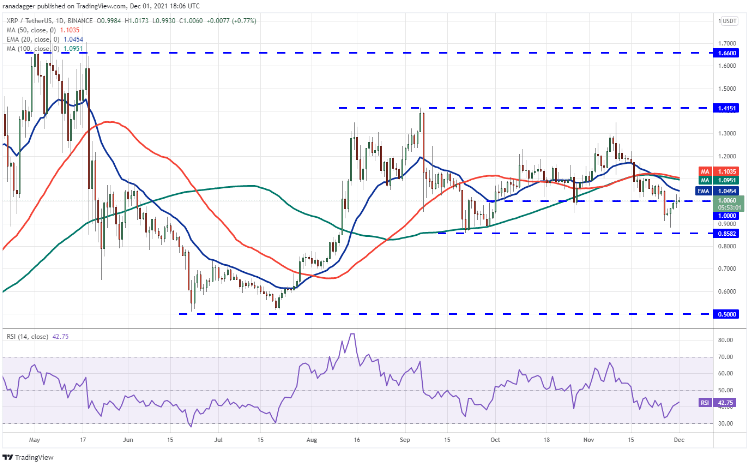 XRP daily chart / Source: TradingView
Polkadot (DOT)
The analyst says that Polkadot (DOT) recovered from $32.21 on November 28 and reached the neckline of the H&S pattern. The falling 20-day EMA ($40) and the RSI below 43 suggest that the bears have prevailed.
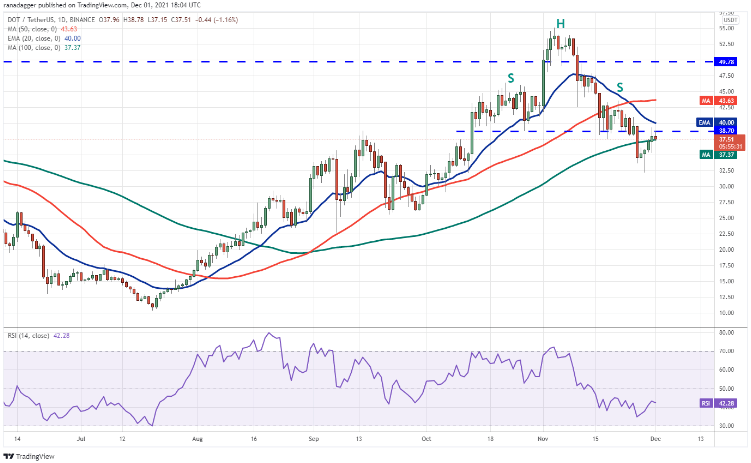 DOT daily chart / Source: TradingView
Dogecoin (DOGE)
According to the analyst, the long wick on Dogecoin (DOGE) candlestick over the past two days indicates that the bears are defending the 20-day EMA ($0.22). The analyst states that this indicates that the sentiment is negative and that traders are selling in the rallies. .
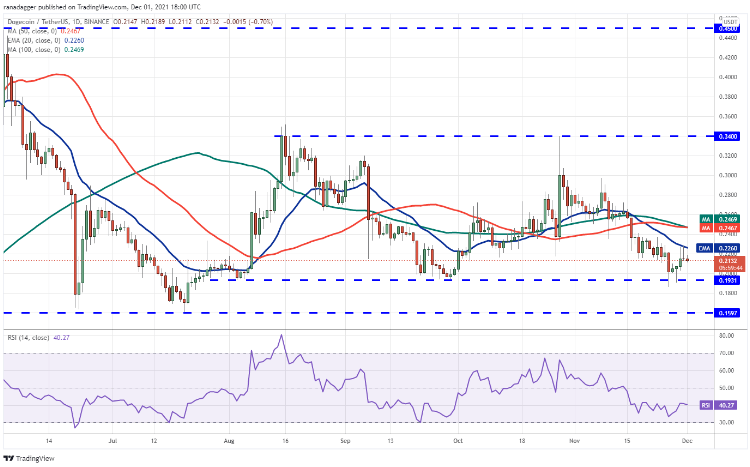 DOGE daily chart / Source: TradingView
Avalanche (AVAX)
The analyst states that Avalanche (AVAX) formed a Doji candlestick pattern on November 30, showing the uncertainty between the bulls and bears, and this indecision was reversed on December 1 as the bulls drove the price higher.
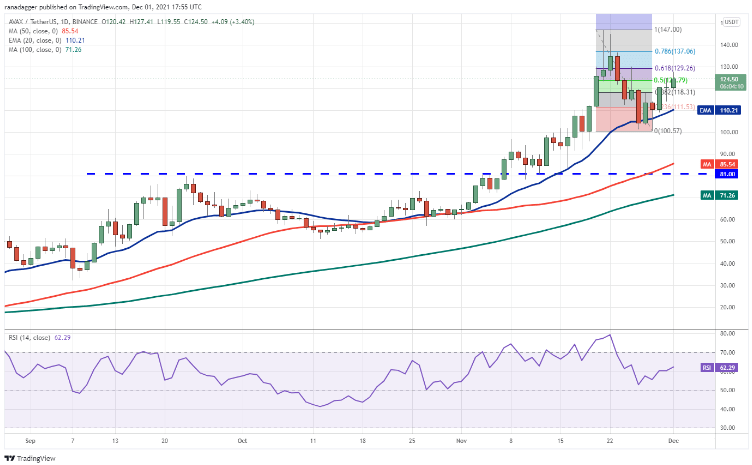 AVAX daily chart / Source: TradingView
Shiba Inu (SHIB)
According to the analyst, the Shiba Inu (SHIB) climbed back above the breakdown level at $0.000040 on Nov. 29, which may have trapped bears in a rush to close their short positions. The analyst states that this pushed the price to $0.000054 on November 30, but the long wick on the candlestick indicates a lack of demand at higher levels.
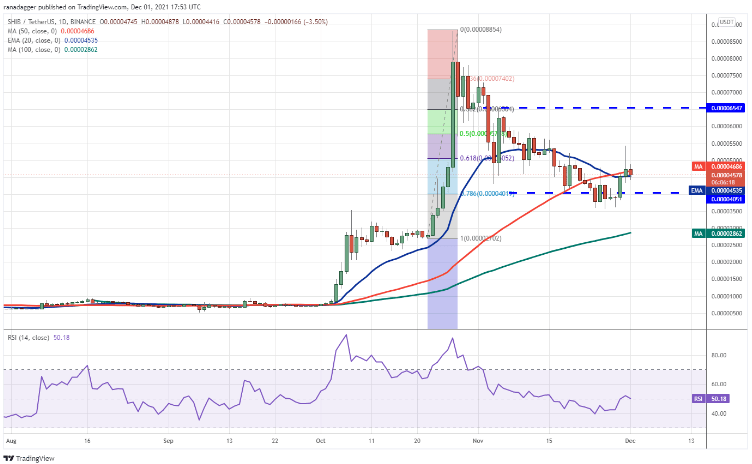 SHIB daily chart / Source: TradingView
 pumps 26% in 6 days — Is there room for more?")


