 Price Analysis: Aiming Upside?")
Ethereum also corrected similarly to Bitcoin and formed a bottom around $4,150. According to technical analysis by NewsBTC’s Aayush Jindal, a new bullish attempt may be made in the near-term:
- Ethereum started a downside correction below the $4,320 and $4,250 levels.
- The pair could start a fresh increase if it stays above the $4.150 support zone.
There is a key bearish channel forming with resistance near $4,300 on the hourly chart of ETH/USD (data from Kraken).
Ethereum Eyes on a New Rising
Ethereum broke below $4.250 and the 100 hourly simple moving average. However, the bulls protected the $4,150 support zone and formed a local bottom in that area. The pair cleared the $4,200 resistance area and is now trying to recover. The next major resistance for ETH is near the $4,300 level. There is also a key bearish channel forming with resistance near $4,300 on the hourly chart of ETH/USD.
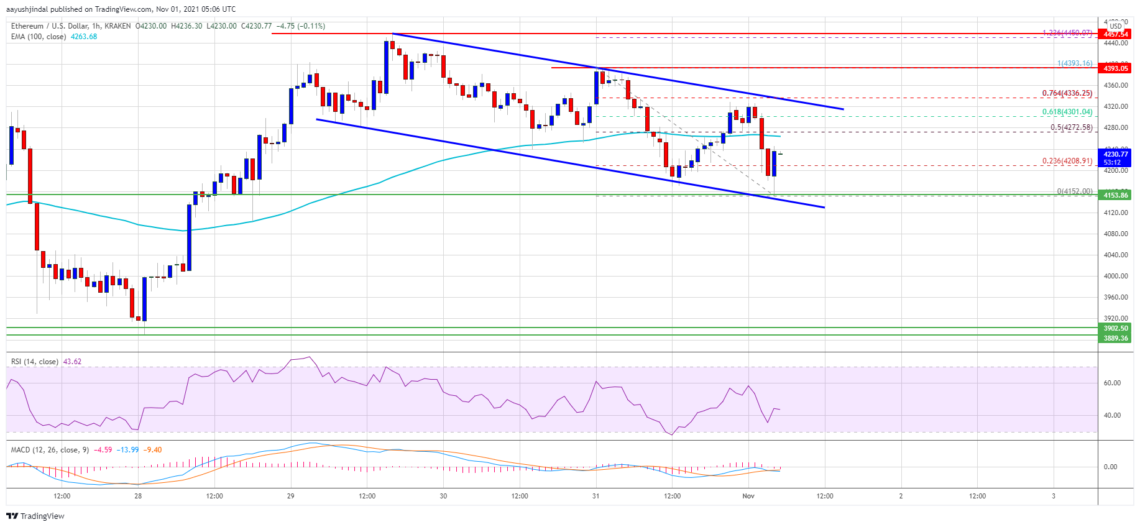
4. A close above the $300 level could lead to a sharp increase in the near term. In the stated case, the price could rally to the $4,400 level. Any further gains could lead the price to the next key hurdle at $4,550.
Will Ethereum Drop?
According to Jindal, Ethereum could start a fresh downside correction if it fails to continue higher above the $4,300 and $4,320 resistance levels. An initial support on the downside is near the $4,200 level. An initial key support is currently formed near the $4,150 level and the recent recent low. A downside break below the $4.150 support could push the price below the $4.100 support. The next key support is near $4,000.
What Do Technical Indicators Say?
- Hourly MACD – The MACD for ETH/USD is losing momentum in the bearish zone.
- Hourly RSI – The RSI for ETH/USD is now below the 50 level.
- Main Support Level – $4.150
- Main Resistance Level – $4,300


