 Price Analysis: Could Follow Bitcoin, What Are The Key Levels?")
Ethereum was also affected by the positive mood that came with the opening of the Bitcoin ETF. Having started a fresh rally above $3.820, ETH needs to surpass the $3,900 and $3,950 resistance levels to continue rising, according to technical analysis by NewsBTC’s Aayush Jindal:
- Ethereum started a fresh increase above the $3,800 and $3,820 resistance levels.
- Price is currently trading above $3,800 and the 100 hourly simple moving average.
- The pair could start a new rally if it surpasses the $3,900 key resistance zone.
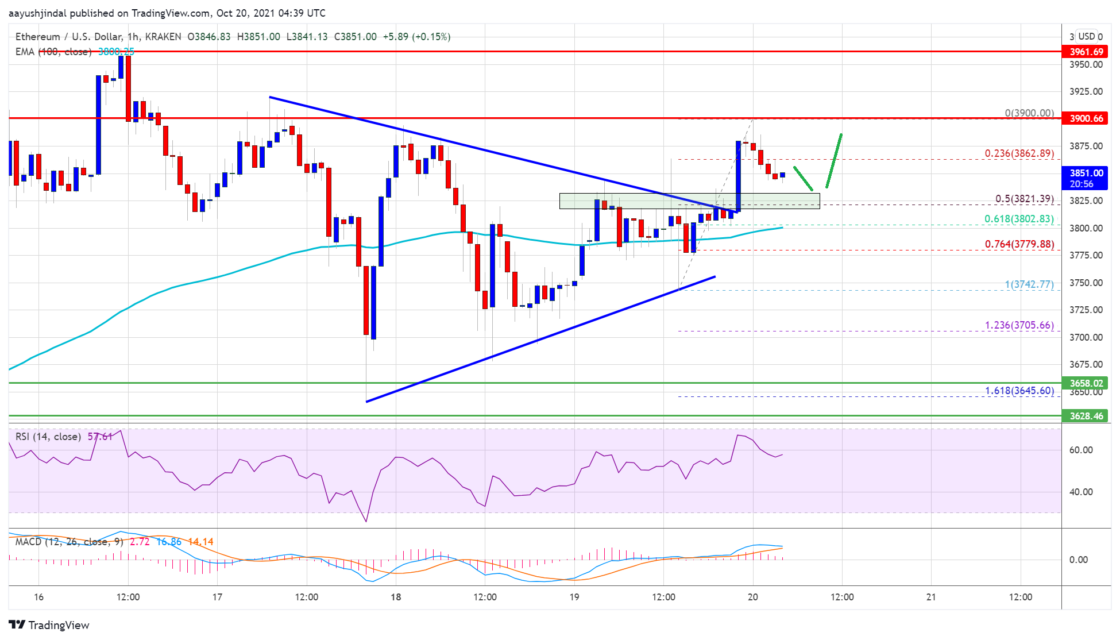
There was a break above a key contracting triangle forming with resistance near $3,820, on the hourly chart of ETH/USD (data from Kraken).
Ethereum Targets More Upside
Leading altcoin Ethereum also took advantage of the positive mood Bitcoin brought with the ETF and started a fresh increase above the $3,750 resistance zone. ETH gained momentum after it broke the $3,800 resistance zone and the 100 hourly simple moving average. There was also a break above a key contracting triangle formation with resistance near $3,820, on the hourly chart of ETH/USD. The pair climbed above $3,880 but failed to continue above $3,920. A local top was formed around $3,900 and it is now consolidating gains. It is now trading above $3,800 and the 100 hourly simple moving average.
According to Jindal, an immediate resistance on the upside is near the $3,880 level. The next major resistance is near the $3,900 level, where the price could start a fresh rally. The next key resistance is near the $3,920 level. Any further gains could increase the chances of a move above the $4,000 level. In the stated case, the price could rally to the $4.120 level.
Will Ethereum Drop?
According to Jindal, if Ethereum fails to continue higher above the $3,880 and $3,900 resistance levels, it could start a fresh downside correction. An initial support on the downside is near the $3,820 level. This is the 50% Fib retracement level of the $3,742 high to $3,900 high near the $3,820 level. Further declines could lead the price towards the $3,780 support and the 100 hourly SMA. The next key support is near $3,750.
What Do Technical Indicators Say?
- Hourly MACD – The MACD for ETH/USD is losing momentum in the bullish zone.
- Hourly RSI – The RSI for ETH/USD is now above the 50 level.
- Main Support Level – $3,820
- Main Resistance Level – $3,900


