Gold pleased investors with its rise last week and continued to rise despite the bearish signals on the chart, according to analysts. So, will the rise continue? Cryptocoin. com we share the comments of analyst Ross J. Burland…
Analyst drew attention to these levels for gold
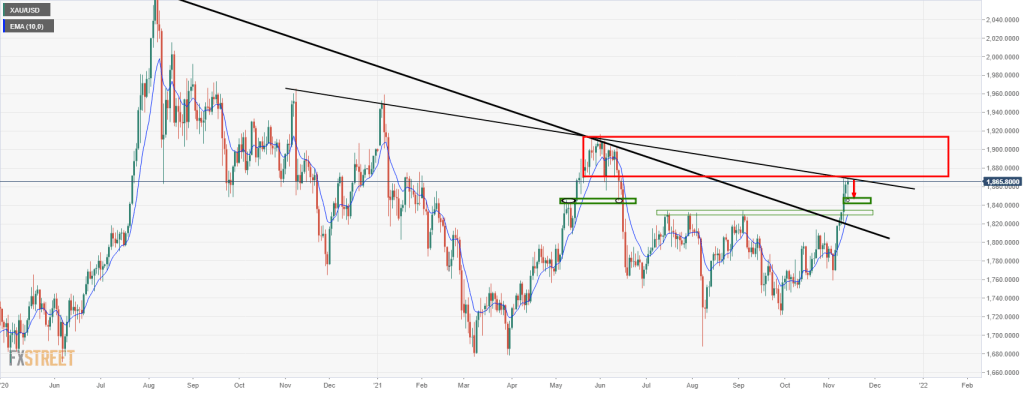
According to gold analyst Ross J. Burland, the market is pricing in a rate hike in the US as the bulls continue to take positions for runaway inflation pressures. He also points out that the technical breakout has drawn significant buying interest from both individual and long-term players. So, technically, what levels are next? Examining the weekly, daily and four-hour charts, Burland says that there is not a single day of decline in November, and marks the following two main formation areas on the weekly chart.
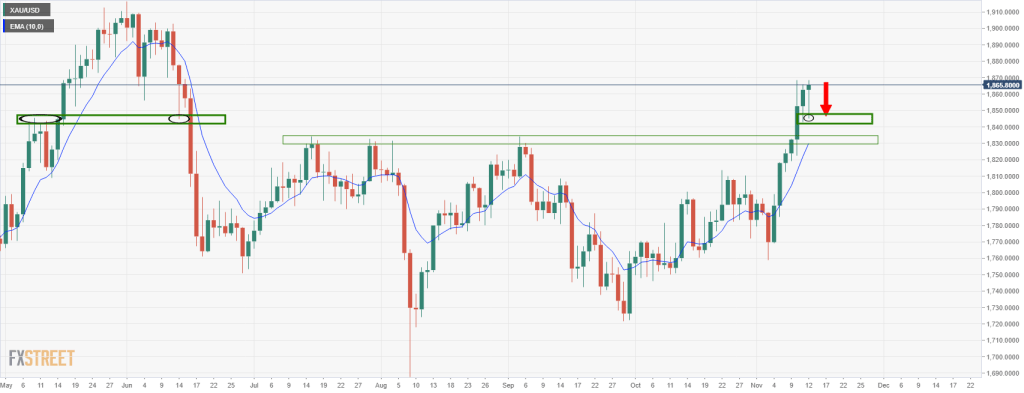
On the other hand, according to the analyst, who pointed out that the price tested the resistance zone and that the bottom levels of May 31 were pierced by exceeding $ 1,856, this indicates $ 1,880 as the resistance zone. According to the analyst, the observation of $ 1, 845 on the daily chart is convincing.
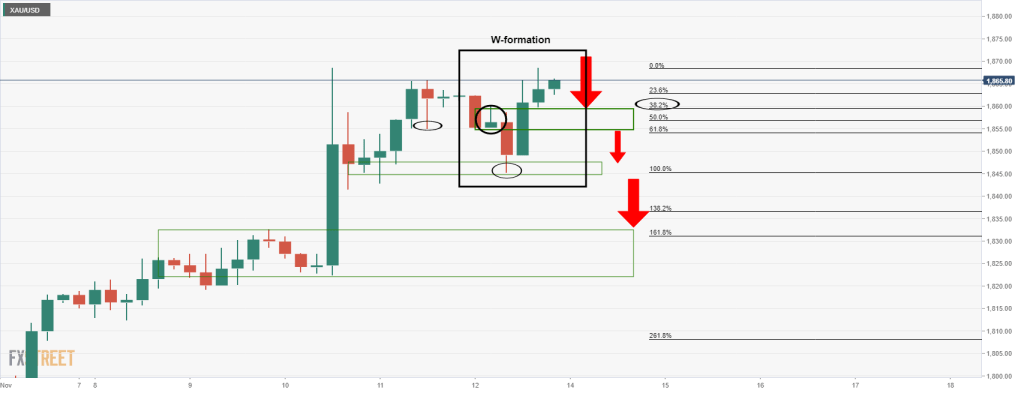
However, Burland states that the combination of the absence of a bearish close recently and a wick observed on the chart on Friday may force the downward movement at the beginning of the week. Finally, according to the expert, what should be noted on the 4-hour chart of the precious metal is that a break from a “W” shaped formation poses a downside risk. However, if there is no breakout, it is thought that the upward movement can continue.