
According to analyst Rakesh Upadhyay, since Bitcoin is still in an uptrend, a possible jump from $ 62,000 could make altcoin projects LTC, LINK, VET and AXS rise even higher. That’s why we take a look at the key technical levels to watch for the week. Let’s start with Bitcoin…
Bitcoin makes up for its November 12 drop
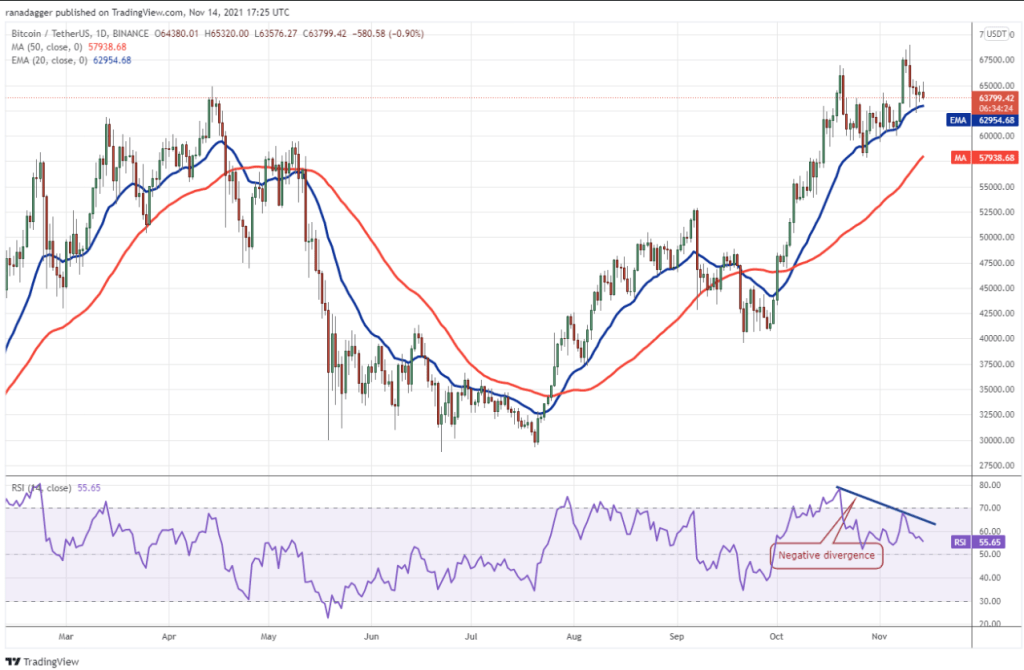
Bitcoin retraced $62,954 on Nov. 12, but this downtrend, which coincided with the 20-day EMA, has not been able to disrupt the uptrend. The technical MA suggests that buyers have the upper hand, but the negative divergence in the RSI warns that the bullish momentum may weaken. According to the analyst, if the price returns to $62,954, the bulls will try to push the price above the ATH level of $69,000 and continue the uptrend. BTC bulls could target $75,000 later. Alternatively, a close below $62,954 will indicate that investors can rush to the exit. The price could later decline to $57,938 and trigger the start of a deeper correction to $52,920.
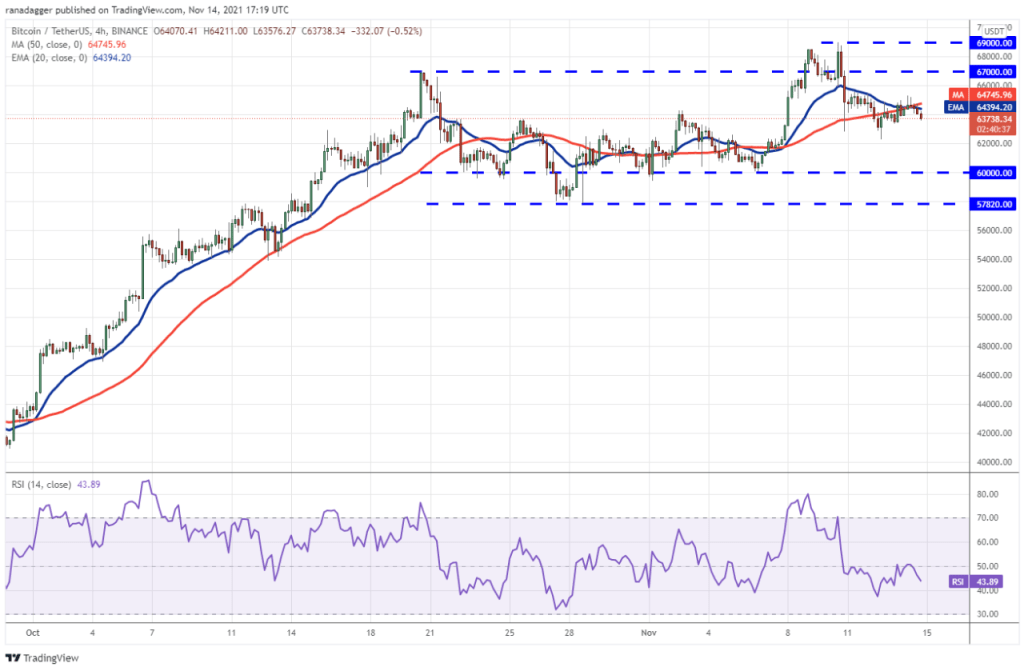
On the 4-hour chart, Bitcoin appears to be consolidating between $60,000 and $67,000. The 20-day EMA is marginally falling and the RSI is just below the midpoint, suggesting that the price could gradually drop to $60,000. A strong bounce from this level will send BTC bulls 67-69, according to the analyst. It can lead between 000 dollars.
Altcoin LTC bulls target these levels
Litecoin price completed the rolling bottom formation by closing above $225.30. If the price rises from the current level or returns to $225.30, buyers will try to continue the uptrend. On a break and close above $300, it could open the doors for a rally to $340. The bears are likely to have other plans as they will try to push and sustain the price below the $225.30 breakout level. If they manage to do so, LTC could drop to $192.
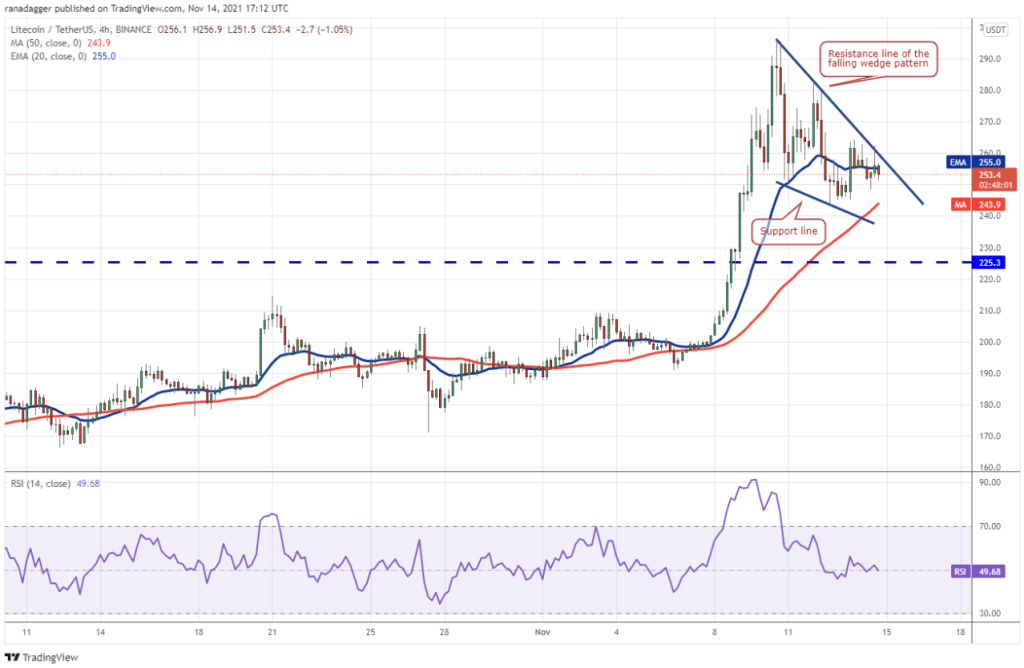
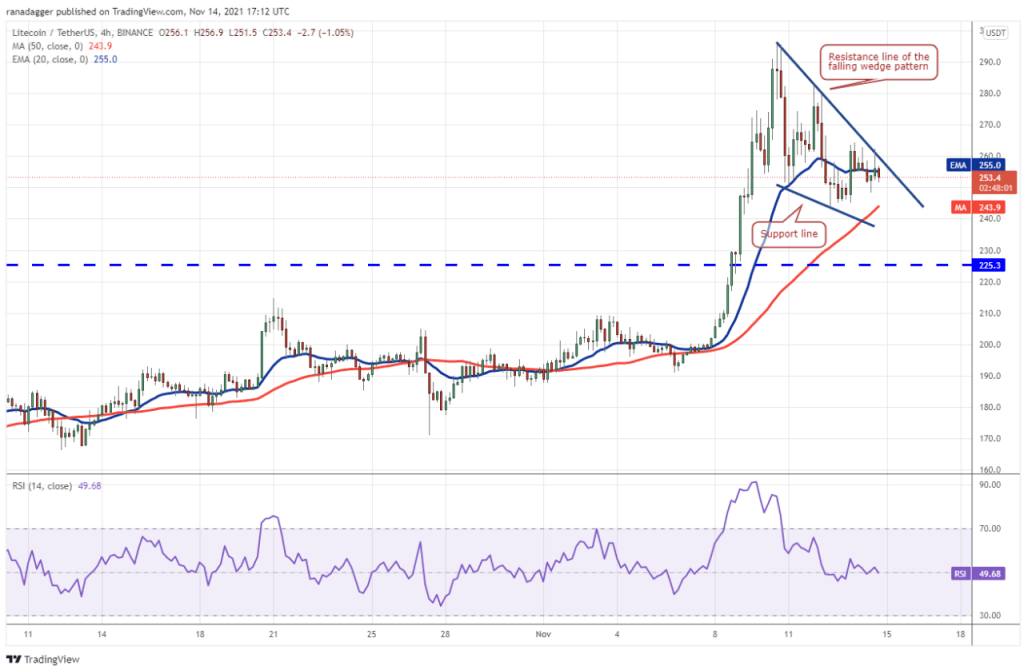
The 4-hour chart shows LTC trading in a falling wedge pattern. If the bulls can continue the uptrend, LTC price could rise to $280 and then $295.70. After that, the bulls’ target will be $302.10.
Altcoin Chainlink (LINK) technical analysis
LINK bulls broke above the overhead resistance of $35.23 on November 9, 10 and 11, but could not keep the price above it. On the technical side, the MAs are rising and the RSI is above 55, showing slight strength in the hands of the bulls. If the price drops to $32.27 and bounces back, the upside target is $42.50, followed by $47.50. If the price stays below $32.27, LINK bears could target $28.83.
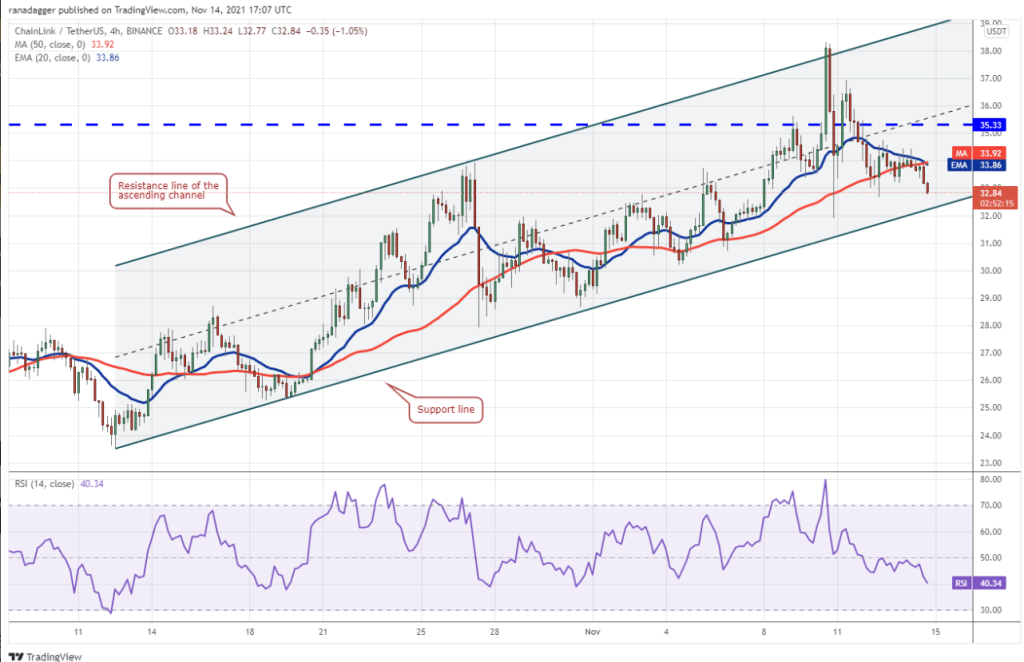
LINK also continues its upward movement within an ascending channel for several days. The bulls tried to push the price above the channel on November 10 but failed. This may have caused the bulls to book profits and the aggressive bears to short. According to the analyst, the support and resistance zones of the channel will be decisive in the price of LINK.

VeChain (VET)
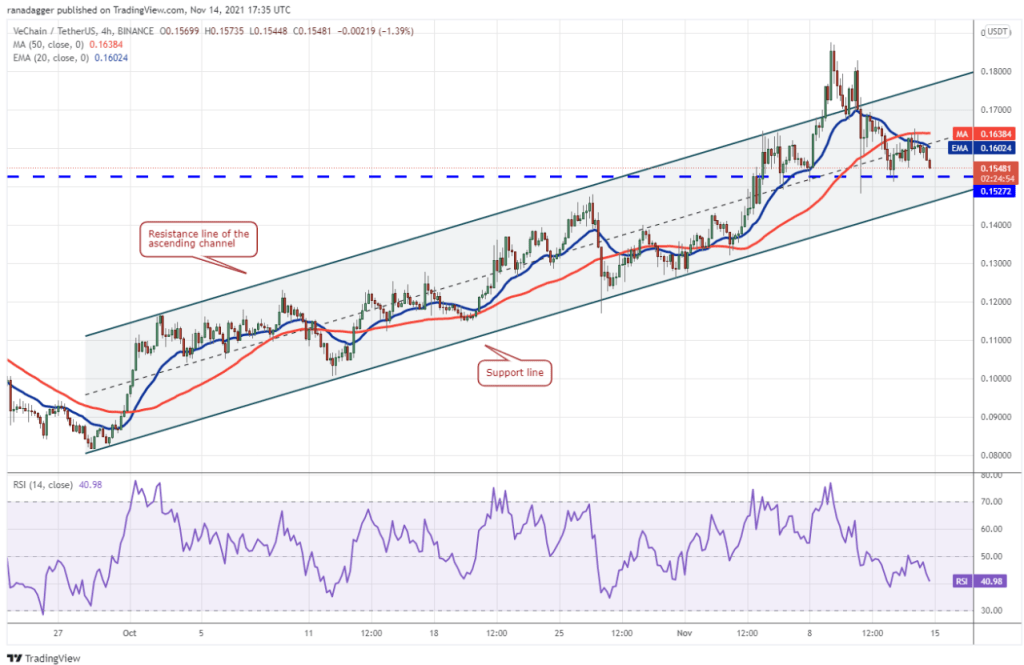
Altcoin VeChain broke above the tough overhead resistance at $0.15 on November 4, showing that the bulls have beaten the bears. The price is back to the breakout level and the bears are trying to push the price below and trap the aggressive bulls. If the price bounces back from the current level, the bulls will try to push VET price above $0.19 and continue the upward move. VET could rally to $0.24 later. Contrary to this assumption, if the price breaks and stays below $0.15, it means that the markets reject higher levels. It could drop to $0.12 later and then to $0.10.

The 4-hour chart shows that the bulls pushed the price above the resistance line of the ascending channel formation but were unable to build on this advantage. A strong rebound from the support line could keep the uptrend stable and the price could continue to trade within the channel. The bears will have to push and sustain the price below the channel to gain the upper hand.
Axie Infinity (AXS)
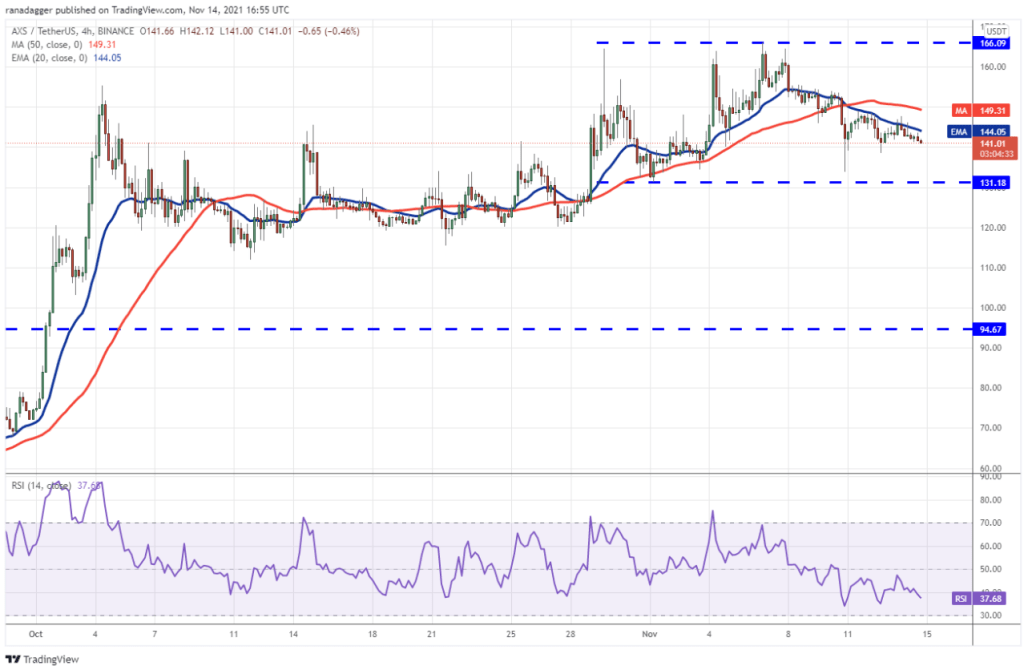
Cryptocoin. com Axie Infinity (AXS) is correcting in an uptrend and has been trading in an ascending channel formation for the past few days. On the technical side, the 20-day EMA has flattened and the RSI has dropped near the midpoint, suggesting that buyers may be losing control. If the price goes out of the support line on the chart, it will show that the upward movement remains intact, according to the analyst. AXS will then attempt to push higher to the ATH level of $166.09. A possible rally to $183 could accelerate later.
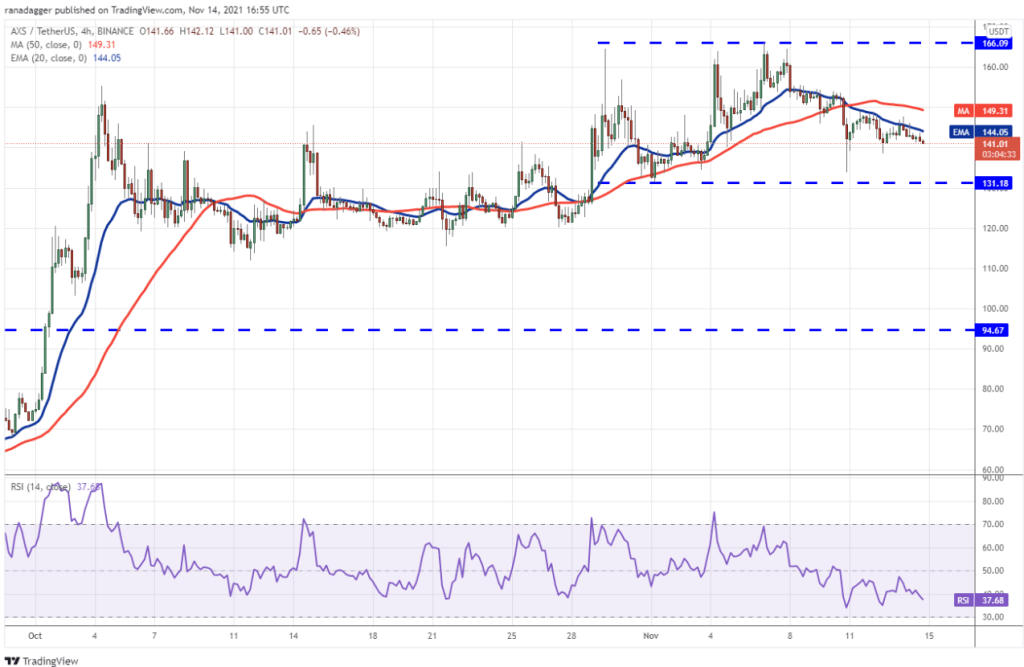
AXS is also consolidating between $166.09 and $131.18. The price is trading below the 20-day EMA on the 4-hour chart, which indicates that the bears are defending this resistance aggressively. If the price bounces back from this support, it will indicate that the bulls continue to accumulate lower. It could then extend its range-bound action for a few more days, according to the analyst. Conversely, a break and close below $131.18 could signal a possible change in the short-term trend. AXS could then decline to the $115 to $120 support zone. According to the analyst, the decline may lead the bears to $ 100 in the continuation.
 pumps 26% in 6 days — Is there room for more?")


