
Bitcoin cools December sharp correction at $40,000 support. According to veteran crypto analyst Rakesh Upadhyay, altcoin projects LINK, ICP, LEO and ONE may show the first signs of recovery if traders feel that the Bitcoin sale is nearing completion. Let’s take a look at the critical levels to watch this week.
Fear and Greed Index hits new lows
Bitcoin (BTC) and most major altcoins are coming under pressure as support declines and bears sell with each attempt to rally. This negative sentiment pushed the Crypto Fear and Greed Index to 10/100, one of its lowest levels ever on January 8th. By contrast, 2021 started with levels of 93/100, which stands for “extreme greed.” That weak new year opening didn’t discourage bullish Bloomberg Intelligence analyst Mike McGlone. In a recent analysis, McGlone said that Bitcoin could rise to $100,000 this year and Ether (ETH) to $5,000 this year.

However, some analysts argue that Bitcoin may have a difficult time sustaining its bullish trend in an environment with rising interest rates. Holger Zschaepitz questioned whether Bitcoin could survive without “trillions of dollars in the lowest rates and central bank money and government incentives.” So, can Bitcoin bypass strong support and attract purchases in certain altcoin projects? Let’s take a look at the technical analysis of 5 cryptocurrencies that may remain positive in the short term.
Bitcoin (BTC) technical analysis
Bitcoin’s downtrend reaches strong support at $39,600. The price formed a candlestick pattern on January 8, showing indecision between the bulls and bears. Both moving averages are sloping down and the RSI is close to the oversold zone, suggesting that the path of least resistance is to the downside. If the bears pull the price below $39,600, selling could intensify and the BTC/USDT pair could start the next strong support at $28,805.
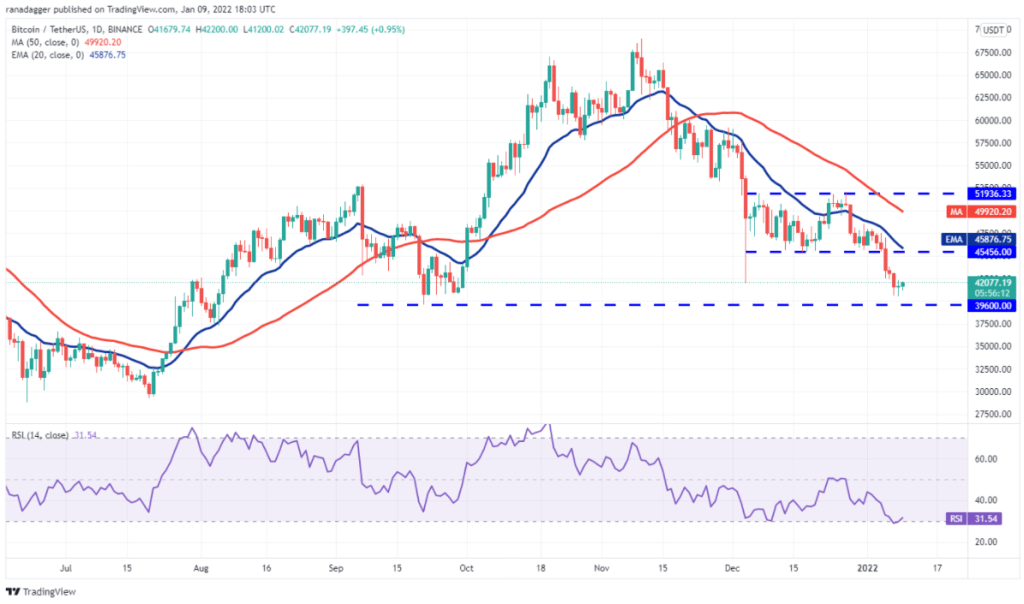
On the other hand, if the price rebounds from the current level, the bulls are targeting the $45,876 region. If the price drops from this level, it will indicate that the sentiment will remain negative and that traders are selling in the rallies. This could increase the likelihood of a break below $39,600. The bulls will have to push and sustain the price above the moving averages to indicate a possible change in trend. The 4-hour chart shows a break in selling momentum and closing below $45,456. The bulls are attempting to stop the decline at $40.501 but an attempt to recover could face strong selling near the 20-day EMA.

On the other hand, if the price drops from the 20-day EMA, the bears will try to push Bitcoin price below $39,600 and extend the downtrend. Alternatively, a break and close above the 20-day EMA could push the pair towards the 50-day simple moving average. If the bulls rise above this resistance, it suggests that the bears may be losing control.
Altcoin LINK rallies 40% against BTC
Chainlink (LINK) has been trading in a wide range between $15 and $35.33 for the past few months. The bulls pushed the price above the moving averages and the RSI rose close to the overbought zone, indicating that buyers have the upper hand in the short term.

The bears have formed a strong challenge near $27.61 for the past few days but the bulls did not allow the price to drop below $23.23. This suggests that sentiment has changed from selling on rallies to buying on dips. If the bulls hold the price above $27.61, the LINK/USDT pair could rise to $30 and then touch the overhead resistance at $35.33. This bullish view will be invalidated if the price drops from the current level and falls below the moving averages. According to the analyst, the LINK price may decline to $18 later.

The 4-hour chart shows the price breaking above the overhead resistance at $27.61. The bears will now try to stop the rise at $30. If the next correction fails below $27.61 it will increase the probability of a rally to $35.33. On the contrary, if the price declines from the current level, it would suggest that a break above $27.61 could be a bull trap. The bears will then try to push the price below the 50-day SMA. If they do, the next stop could be $22.
Internet Computer (ICP) technical analysis
Cryptocoin. com Internet Computer (ICP), which we included in their analysis, broke above the downtrend line on January 4 and closed; this was the first indication that the downtrend might end. The bears tried to trap the aggressive bulls and push the price below $29 but failed.

The bulls pushed the price back above the downtrend line on January 8 and closed. The moving averages are on the verge of a bullish crossover and the RSI has bounced back into the positive territory, showing that the bulls are trying to make a comeback. If buyers hold and sustain the price above $38.02, the ICP/USDT pair could rally to $45.79. This level could act as a tough hurdle again, but if surpassed, the upside move could reach $58.30. Contrary to this assumption, if the price drops from the current level and falls below the 20-day EMA, it will indicate that a break above the downtrend line could be a bull trap.

The 4-hour chart shows that the bulls pushed the price above $33.29 but struggled to break through the hurdle at $38.02. This confirms that the bears continue to sell near the overhead resistance. Thus, ICP/USDT is stuck between the two levels. If the bulls propel the price above $38.02 and sustain it, the pair could extend its upward move. Conversely, if the price breaks down from overhead resistance, the bears will attempt to push the price below $33.29. If they do, the pair could drop to the 50-day SMA.
UNUS SED LEO (LEO)
UNUS SED LEO (LEO) has been trading in a gradual uptrend for the past few weeks, with $3.55 acting as strong support. The bears tried to push the price below the 50-day SMA on January 7, but the bulls did not give up. This resulted in a strong recovery that pushed the LEO/USD pair back above $3.60 on January 8.

The bulls will now try to push the price above the ATH level of $3.92. If they are successful, the altcoin price could continue its uptrend and reach $4.25. This positive view will be invalidated if the price drops and breaks below the 50-day SMA. The analyst thinks these levels could start a correction to $3.40.
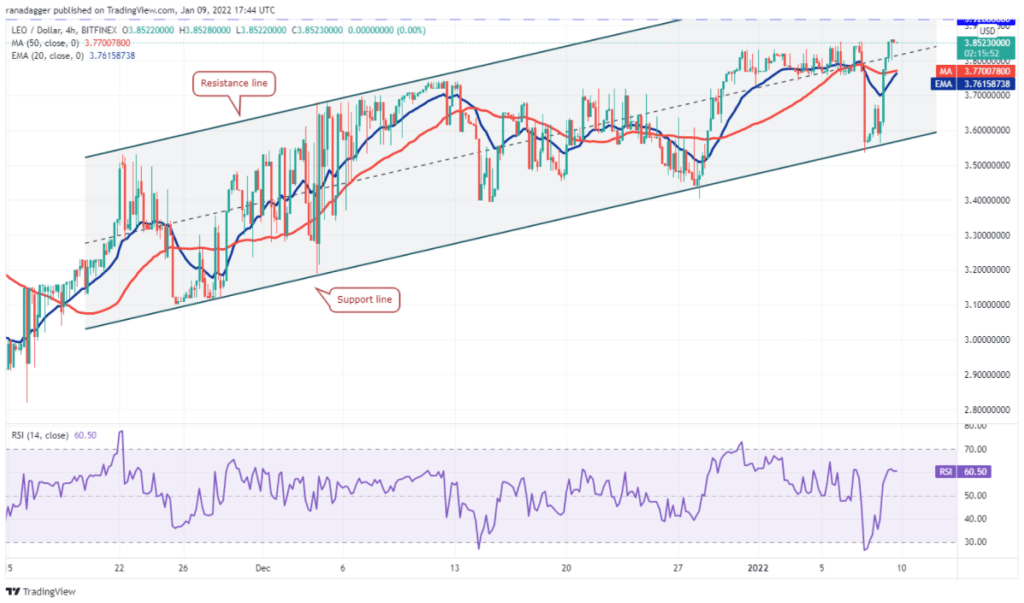
The pair is trading inside an ascending channel pattern. The bears formed a strong resistance near $3.85, which may have drawn profit bookings from short-term traders. This brought the pair to the support line of the channel where buyers stepped in and stopped the decline. The bulls are again trying to hold and sustain the price above $3.85. If they succeed, LEO could begin its journey towards the resistance line of the channel. The bears will have to push and sustain the price below the channel to invalidate the bullish view.
Altcoin ONE bulls prepare for critical resistance levels
Harmony (ONE) has been trading between $0.27 and $0.33 for the past few days. This shows that bulls buy on dips and bears sell on rallies.

Ascending 20-day EMA and RSI in positive territory give buyers an edge. If the bulls push the price above $0.33, the upward move could continue. The ONE/USDT pair might try to rise to $0.38 later. Contrary to the assumption, if the price breaks below the 20-day EMA, it will indicate that the bears have beaten the bulls. This could push the pair to $0.24 and later to $0.21.

The 4-hour chart is rising inside an ascending channel pattern. Although the bulls pushed the price above the channel, they were unable to sustain higher. This shows that the bears are trying to trap the aggressive bulls. The price is back in the channel, but a minor positive was its bounce from the 50-day SMA. This shows that sentiment remains positive and the bulls are buying on the dips. If the price rises above the 20-EMA, the pair could rise to the resistance line of the channel again. A break and close above this level could signal an increase in momentum. Conversely, a break and close below the 50-SMA could pull the pair towards the support line of the channel.
 pumps 26% in 6 days — Is there room for more?")


