
According to crypto analyst Rakesh Upadhyay, Bitcoin and AVAX most major altcoins have risen from their respective support levels, indicating an improving sentiment. The analyst states that this indicates that traders are starting to buy on small dips. Can Bitcoin continue to recover in the next few days and push altcoins higher? The analyst examines the charts of the top 10 cryptocurrencies to find out. we too Cryptocoin. com, with the narration of Rakesh Upadhyay, we have prepared their analysis for our readers.
An overview of the crypto market
Billionaire and Mexico’s third richest person, Ricardo Salinas Pliego, said in his Christmas and New Year message to stay away from fiat money, calling it “fake money made of paper lies”. Instead, he advised people to “Invest in Bitcoin”. However, veteran trader Peter Brandt warned that “chart pattern breakouts should be viewed with great suspicion” during the low-traded holiday period in the last half of December.
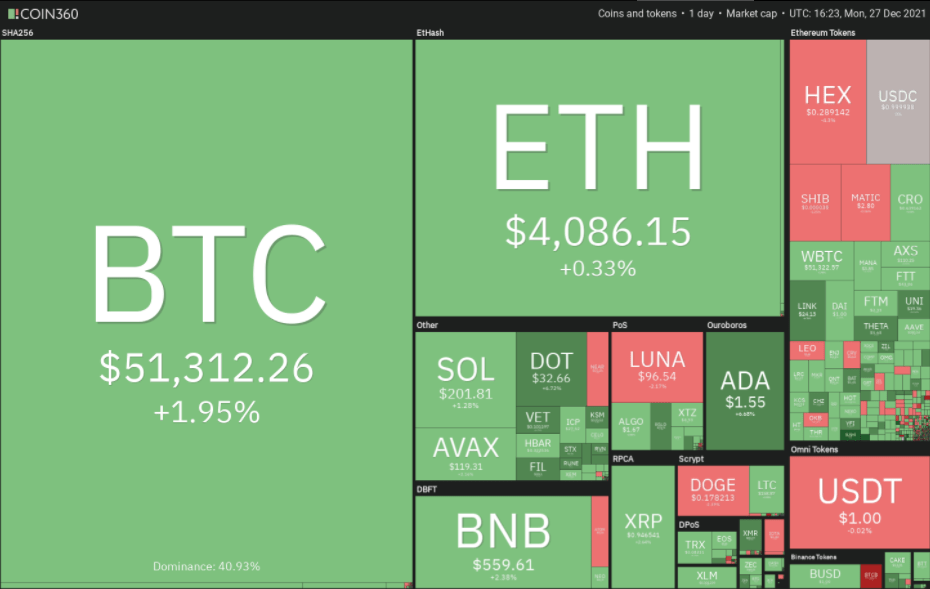 Daily cryptocurrency market performance. Source: Coin360
Analysts remain optimistic for 2022. One of them, the crypto analyst and Twitter user ‘DecodeJar’, believes that Bitcoin could exceed $100,000 and reach its conservative price target of $190,000.
BTC, ETH, BNB, SOL and ADA analysis
Bitcoin (BTC)
Bitcoin has successfully maintained its 20-day exponential moving average (EMA) ($50,033) for the past three days, signaling that the bulls are buying on the dips. This is likely to attract more buying from the bulls.
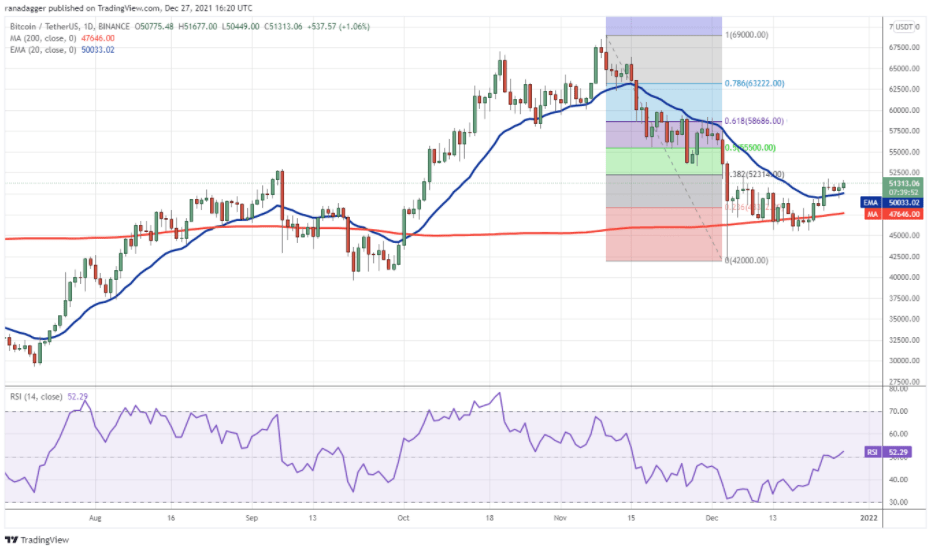 BTC daily chart / Source: TradingView
The 20-day EMA has started to rise and the relative strength index (RSI) has moved into positive territory, indicating the bulls have an advantage. If buyers push the price above the 38.2% Fibonacci retracement level at $52.314, a rally to the hard overhead resistance at $60,000 is likely. The bears are likely to fiercely defend this level. This bullish view will be rejected if the price retraces from the current level or overhead resistance and dips below the moving averages. This could pull BTC towards strong support at $45,456.
Ethereum (ETH)
Ethereum (ETH) broke and closed above the 20-day EMA ($4,065) on Dec. 23, but the bulls failed to develop this advantage. This shows that the bears have not given up yet and are selling on the rallies.
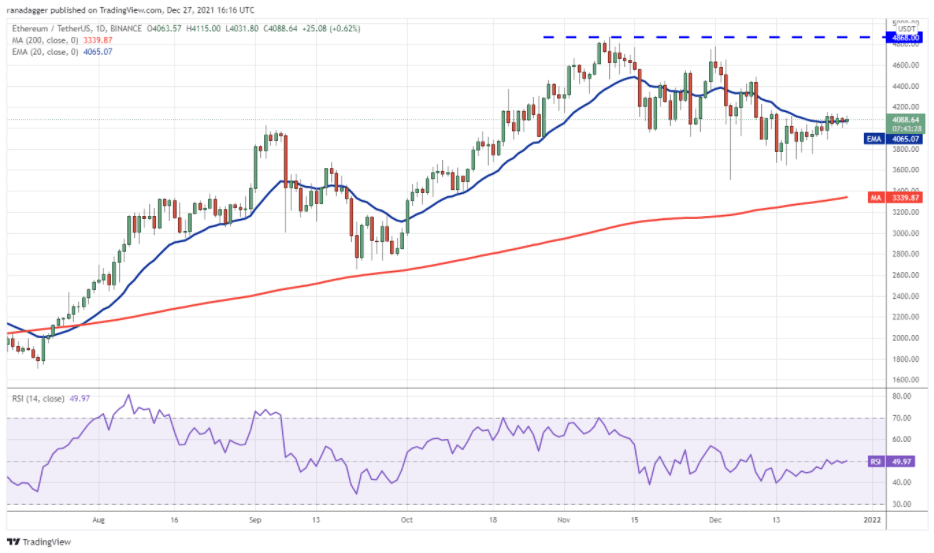 ETH daily chart / Source: TradingView
The flat 20-day EMA and RSI near the midpoint suggest a balance between supply and demand. The bullish momentum could increase if the bulls propel and sustain the price above the overhead resistance at $4,200. This could open the way for a possible rally to $4,488, followed by a retest of the all-time high of $4,868. Conversely, if the price declines from the current level and dips below $3,893.23, it indicates that the bears have taken the lead. This could pull ETH to $3,643.73 followed by the 200-day simple moving average (SMA) ($3,339).
Binance Coin (BNB)
After trading close to the 20-day EMA ($549) in the past three days, Binance Coin broke above resistance on Dec.
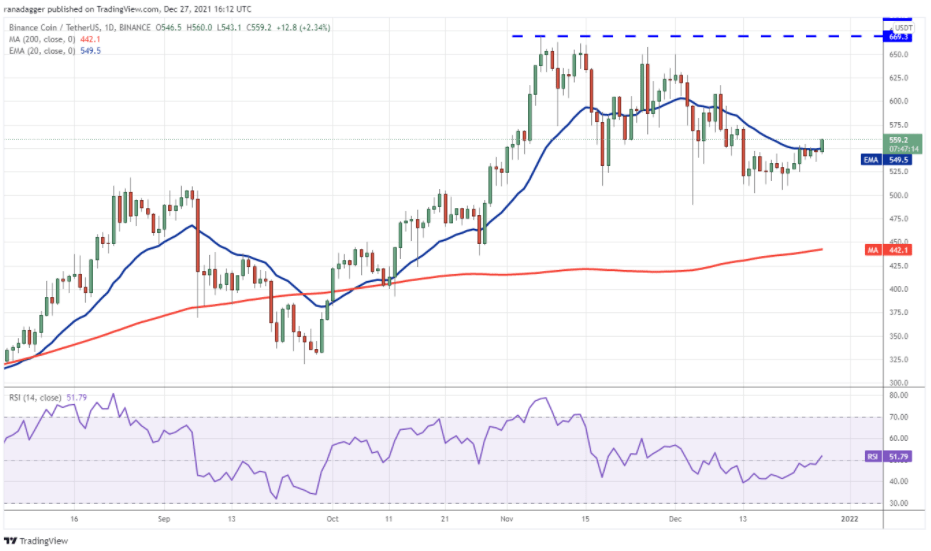 BNB daily chart / Source: TradingView
The 20-day EMA is flat and the RSI is just above the midpoint, indicating an equilibrium between the bulls and bears. If the price continues above the 20-day EMA, it will show that the bulls have beaten the bears. BNB could rally to $575 and then to $617. Alternatively, if the price drops from the current level, the bears will try to pull BNB to $500. This is an important support for the bulls’ defense because if it breaks, the drop could extend to the 200-day SMA ($442).
Left (LEFT)
Solana broke and closed above the 20-day EMA ($187) on Dec. 23, suggesting that the correction may be coming to an end. The bears tried to push the price below the 20-day EMA on Dec. 24, but the bulls did not give up.
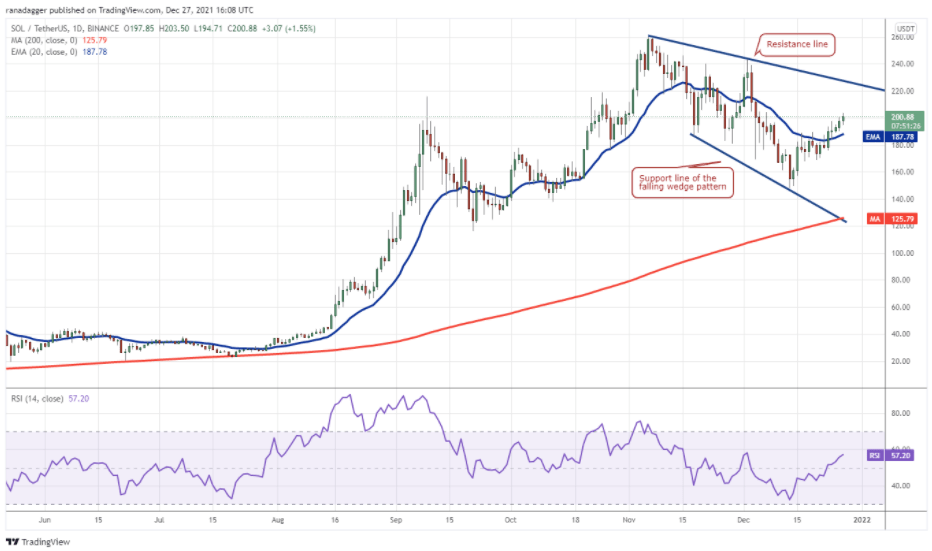 SOL daily chart / Source: TradingView
This may have attracted more purchases by traders. The LEFT can now rise to the resistance line of the falling wedge formation where the bears are likely to form stiff resistance. If the price drops from the resistance line but bounces back from the 20-day EMA, it indicates that the bulls are buying on every small dip. This will open the doors for a retest of $259.90, increasing the likelihood of a break above the wedge. Conversely, if the price declines and breaks below the 20-day EMA, the SOL could drop to $167.88. A break below this support could drop the SOL to the 200-day SMA ($125).
Cardano (ADA)
The bulls have successfully defended the 20-day EMA ($1.39) for the past three days. This shows that sentiment has turned positive and traders are buying on the dips. ADA continued its recovery on December 27.
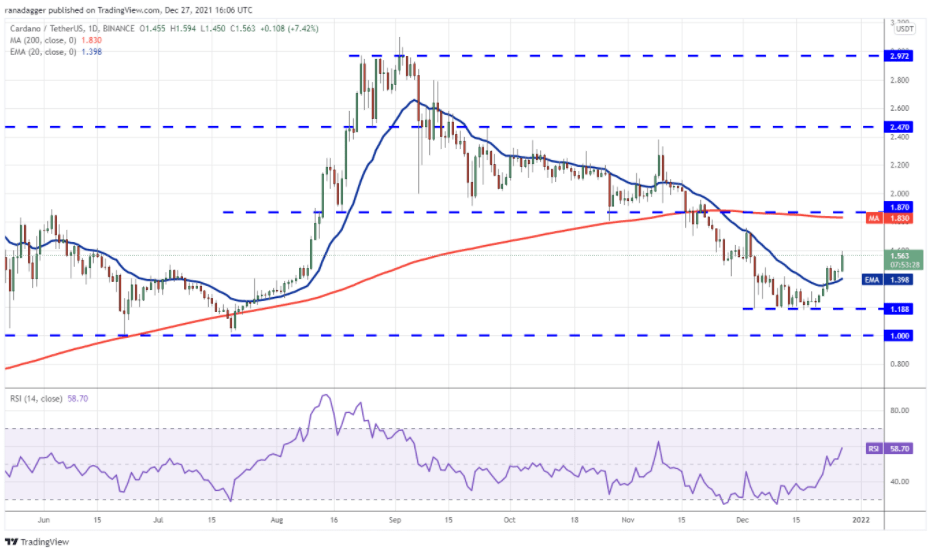 ADA daily chart / Source: TradingView
The RSI has broken above 58 and the 20-day EMA has started to rise, indicating that the bulls are attempting a reversal. ADA could rally to the stiff overhead resistance at $1.76 and then $1.87. This bullish view will be invalidated if the price drops from the current level and dives below the 20-day EMA. Such a move will show that the bears are selling in the rallies. The bears will then try to push ADA below $1.18. If they do, ADA could drop to $1.
XRP, LUNA, AVAX, DOT and DOGE analysis
Ripple (XRP)
Ripple bounced back from psychological resistance at $1 on Dec. 24, which indicates that the bears are active at higher levels. Sellers pulled the price to the 20-day EMA ($0.90), but the fact that the bulls have stayed at this level for the past three days is indicative of minor positivity.
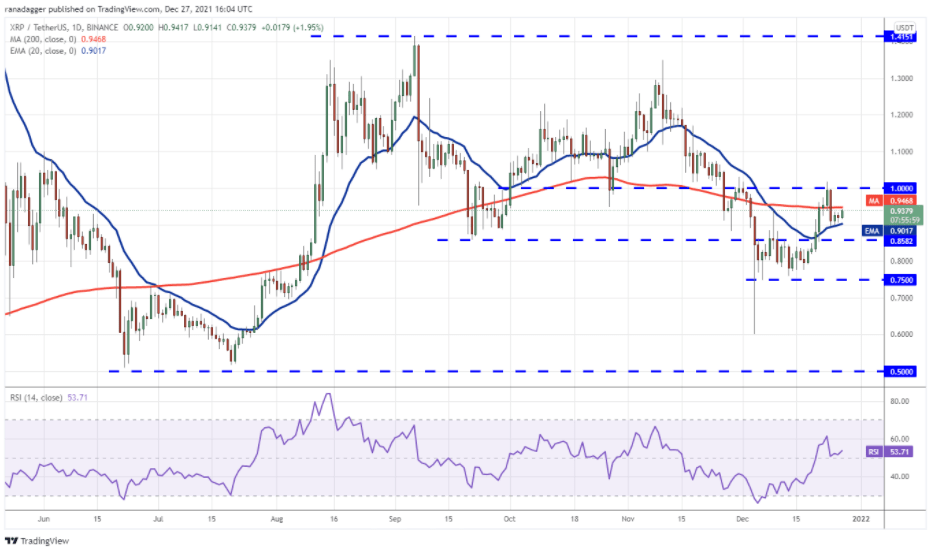 XRP daily chart / Source: TradingView
Terra (LUNA)
The bulls have repeatedly pushed LUNA above the $100 resistance over the past three days but have been unable to sustain higher. This indicates that the bears continue to defend this level aggressively.
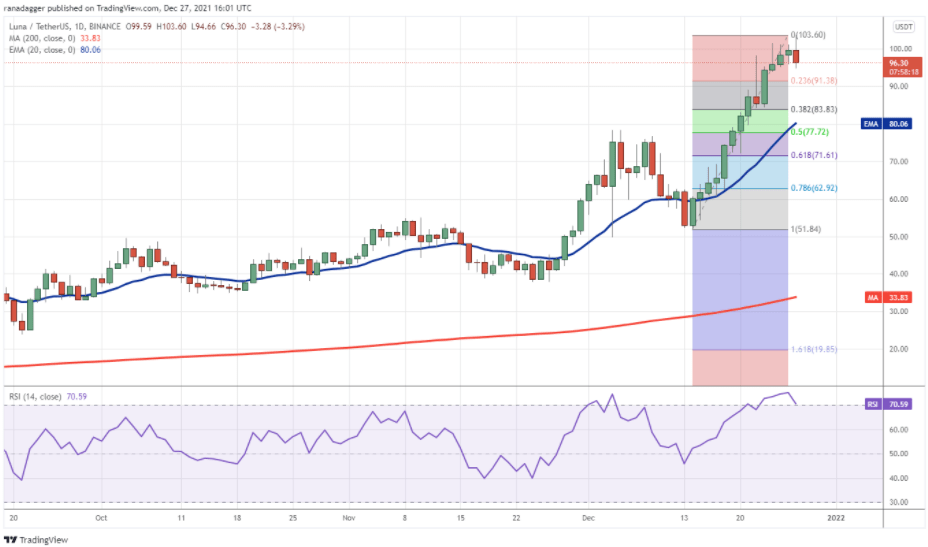 LUNA daily chart / Source: TradingView
Avalanche (AVAX)
AVAX once again bounced off the 20-day EMA ($109) on Dec. 26, showing that the bulls are buying on the dips. The ascending 20-day EMA and the RSI above 57 indicate that the bulls have the upper hand.
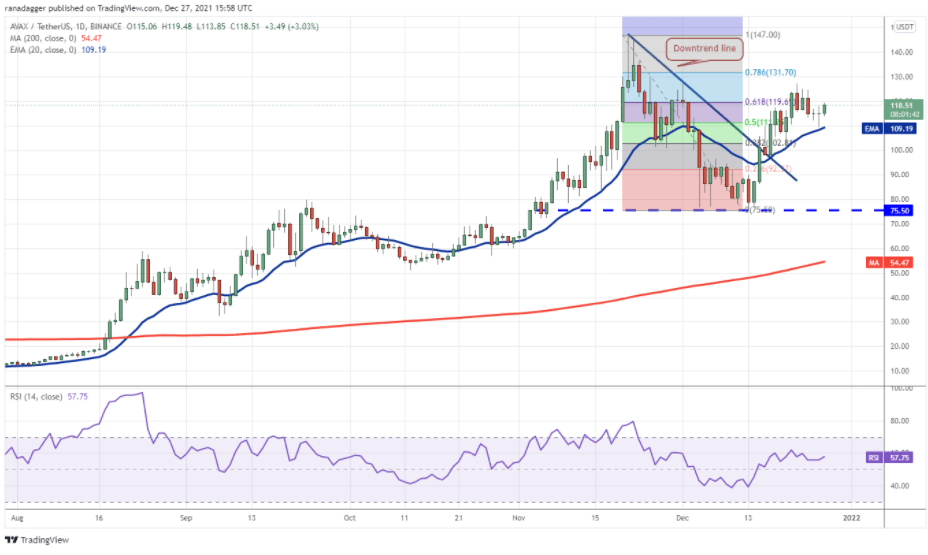 AVAX daily chart / Source: TradingView
If the price continues above the 20-day EMA, the bulls will attempt to clear the overhead resistance zone between the 61.8% Fibonacci retracement level of $119.69 and the 78.6% retracement level at $131.70. If successful, AVAX could rise to an all-time high of $147. On the contrary, if the price retraces from the current level or the general area and dips below the 20-day EMA, it indicates that traders are booking profits at higher levels. AVAX could then drop to $98 where buyers can try to stop the decline.
Polkadot (DOT)
The bulls successfully defended the 20-day EMA ($28.91) on Dec. 24 and 25. This shows that the sentiment has turned positive and traders are buying on the dips. Continuous buying pushed Polkadot above the overhead resistance at $31.49 on Dec. 27.
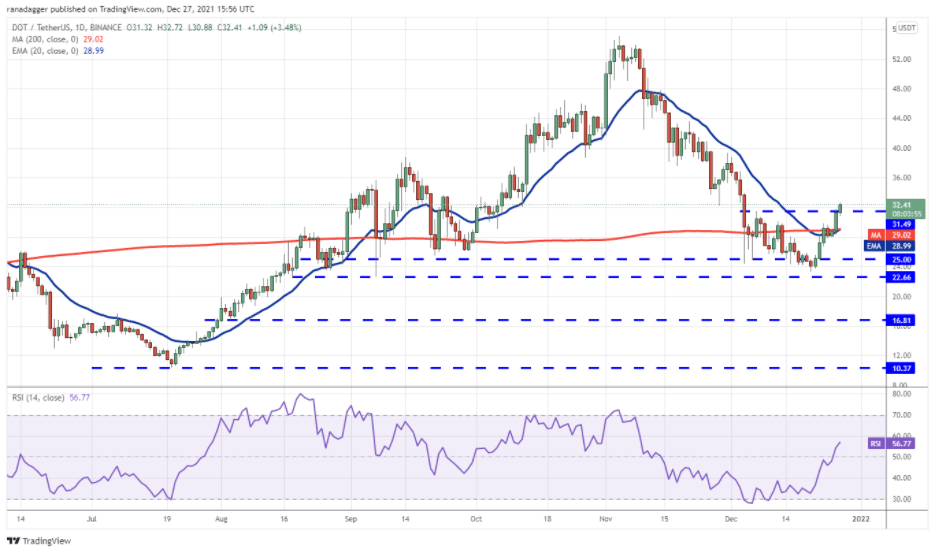 DOT daily chart / Source: TradingView
Dogecoin (DOGE)
Dogecoin has been trading between the 20-day EMA ($0.18) and the overhead resistance at $0.19 for the past three days. This shows that both bulls and bears are playing it safe and not placing big bets.
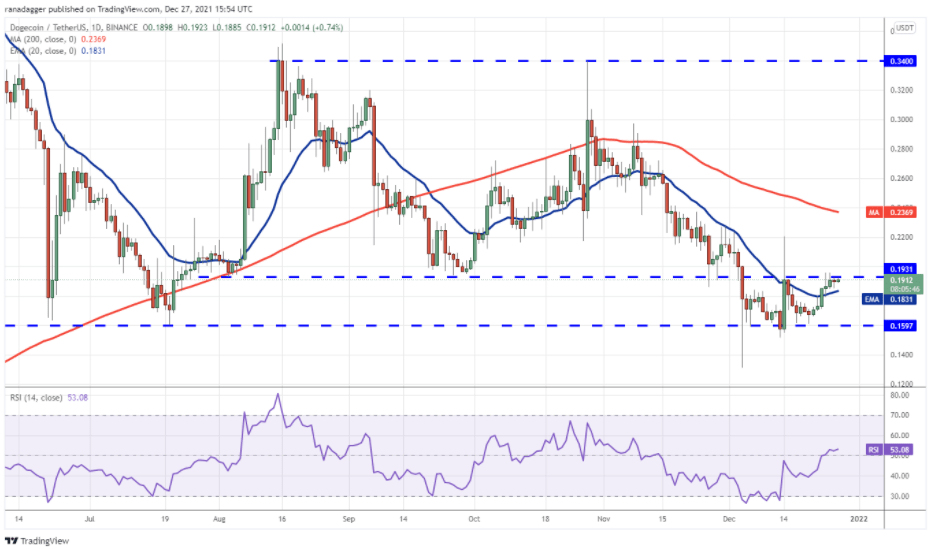 DOGE daily chart / Source: TradingView
 pumps 26% in 6 days — Is there room for more?")


