 Price Analysis: Again Above $50,000, Will the Rising Continue?")
Bitcoin started a fresh rise above the $50,000 resistance. Technical analysis by NewsBTC’s Aayush Jindal is showing positive signals and could target more gains towards $52,000.
Bitcoin Gains Momentum
Bitcoin started a fresh increase above the $48,000 level. There was a break in a key bearish channel with resistance near $48,800 on the hourly chart of the BTC/USD pair. The pair climbed above the $50,000 resistance zone to move into a positive zone. The bulls managed to push the price above the $50,000 level.
Bitcoin rallied as high as $51,500 and is now consolidating its gains. This is 23% of the rise from $48,105 to $51,500. It is well above the 6 Fib retracement level. It is also trading well above $50,000 and the 100 hourly simple moving average.
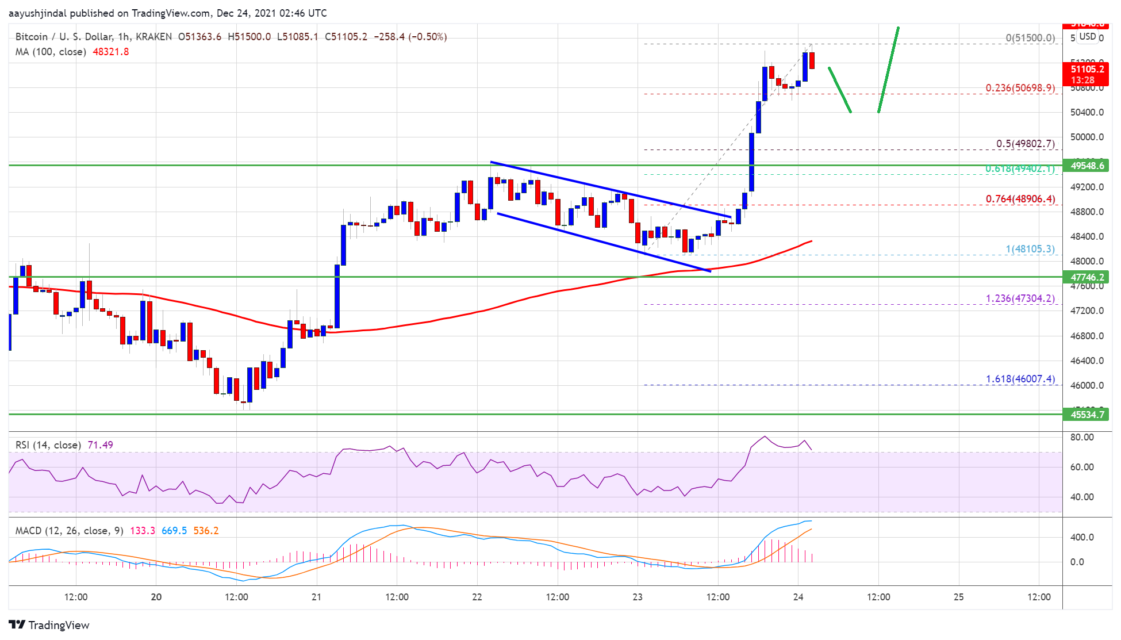
An immediate upside resistance is near the $51,500 level. The next key resistance could be $52,000. A clear move above the $52,000 resistance area could push the price higher. The next major stop for the bulls is likely near the $53,200 level.
Will Bitcoin Drop?
Jindal says that if Bitcoin fails to break past the $51,500 resistance zone, it could start a downside correction. An immediate support on the downside is near the $50,700 level. The first major support is near $50,000. It is close to the 50% Fib retracement level of the recent rise from the $48.105 low to the $51,500 high. A downside break below the $50,000 level could increase selling pressure in the near term. In the stated case, the price may perhaps decline to the $48,800 support zone.
What Do Technical Indicators Say?
- Hourly MACD – The MACD is slowly losing momentum in the bullish zone.
- Hourly RSI (Relative Strength Index) – The RSI for BTC/USD is well above the 50 level.
- Main Support Levels – 50,700 followed by $50,000
- Main Resistance Levels – $51,500, $52,000, and $53,200


? Flare Token Price and Comment")
