 Price Analysis: Consolidating, Rally Soon?")
Bitcoin was tense yesterday before the Fed meeting announcements and fell sharply to $60,000 during the announcements. Bitcoin, which quickly recouped its losses and regained the $63,000 level, is now struggling to gain momentum above $63,500. According to technical analysis by NewsBTC’s Aayush Jindal, if BTC clears $63,500 and $64,000 in the short term, it could start a new rally:
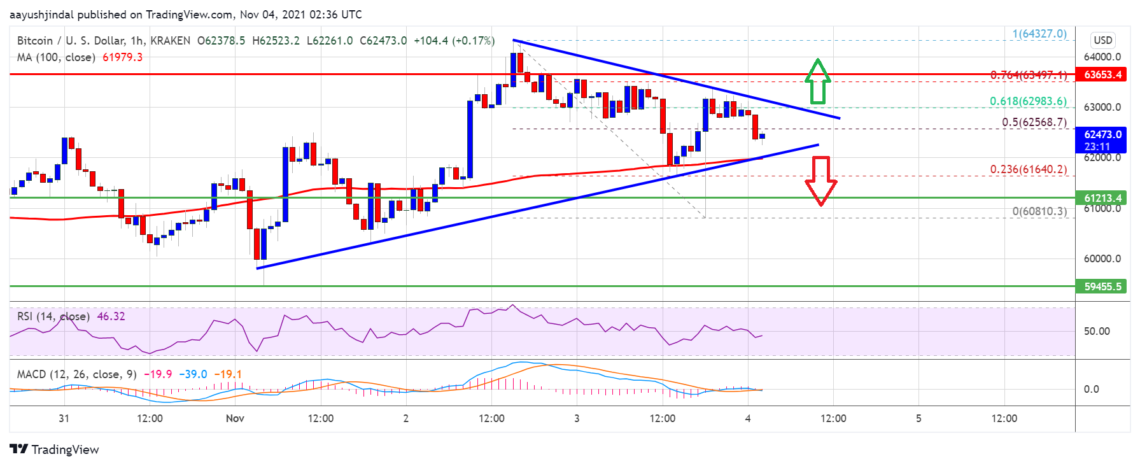
- Bitcoin is facing resistance near the $63,500 and $64,000 levels.
- Price is currently trading above $62,500 and the 100 hourly simple moving average.
- There is a major contracting triangle forming with support near $62,000 on the hourly chart of the BTC/USD pair (based on Kraken data).
- The pair could start a fresh rally if there is a clear break above $63.500.
Bitcoin Consolidates
Bitcoin experienced a volatility yesterday due to the Fed meeting and fell to $ 60,810. It started to rise from this area and there was a break above the $62,000 resistance area and the 100 hourly SMA. Bitcoin surpassed the 50% Fib retracement level of the drop from the $64,327 high to $60,810 low. It is currently consolidating above the $62,000 level and the 100 hourly SMA.
An immediate upside resistance is near the $62,800 level. The first major resistance is near the $63,000 level. There is also a major contracting triangle forming with support near $62,000 on the hourly chart of the BTC/USD pair. The main resistance is still near the $63,500 level. That’s 76% of the drop from $64,327 to $60,810. Close to the 4 Fib retracement level. A clear break above the $63.500 resistance could likely open the doors for a fresh rally. The next major resistance is sitting near the $65,000 level.
Will Bitcoin Drop?
According to Jindal, if Bitcoin fails to break past the $63,500 resistance zone, it could start a fresh decline. An immediate support on the downside is near the $62.200 level. The first major support is now forming near the $62,000 level and the lower triangle trend line. A clear close below the $62,000 support could open the doors for a move towards the $60,000 level.
What Do Technical Indicators Say?
- Hourly MACD – The MACD is slowly losing momentum in the bearish zone.
- Hourly RSI (Relative Strength Index) – The RSI for BTC/USD is now below the 50 level.
- Main Support Levels – 62,000 then $60,800
- Main Resistance Levels – $62,800, $63,500 and $64,000


