 Price Analysis: Targeting a New Uptrend?")
Bitcoin yesterday, although it started a new rise with Fed Chairman Powell’s inflation rhetoric, it experienced a correction below the $57,000 support level with tapering rhetoric. BTC is now trading above the $56,200 support, near $57,200. According to technical analysis by NewsBTC’s Aayush Jindal, it needs to cross $58,500 for it to start a big increase in the coming sessions.
Bitcoin Shows Bullish Signals
Bitcoin corrected below the $57,000 support level after Powell’s tapering rhetoric. On the other hand, it remained stable above the $56.200 support level and the 100 hourly simple moving average.
BTC is now trading above $57,000 and the 100 hourly simple moving average. An immediate resistance on the upside is near the $57,850 level. This is close to the 50% Fib retracement level of the drop from the $59.230 low to $56.555 low. The first major resistance is near the $58,200 level. There is also a major contracting triangle forming with resistance near $58.200 on the hourly chart of the BTC/USD pair.
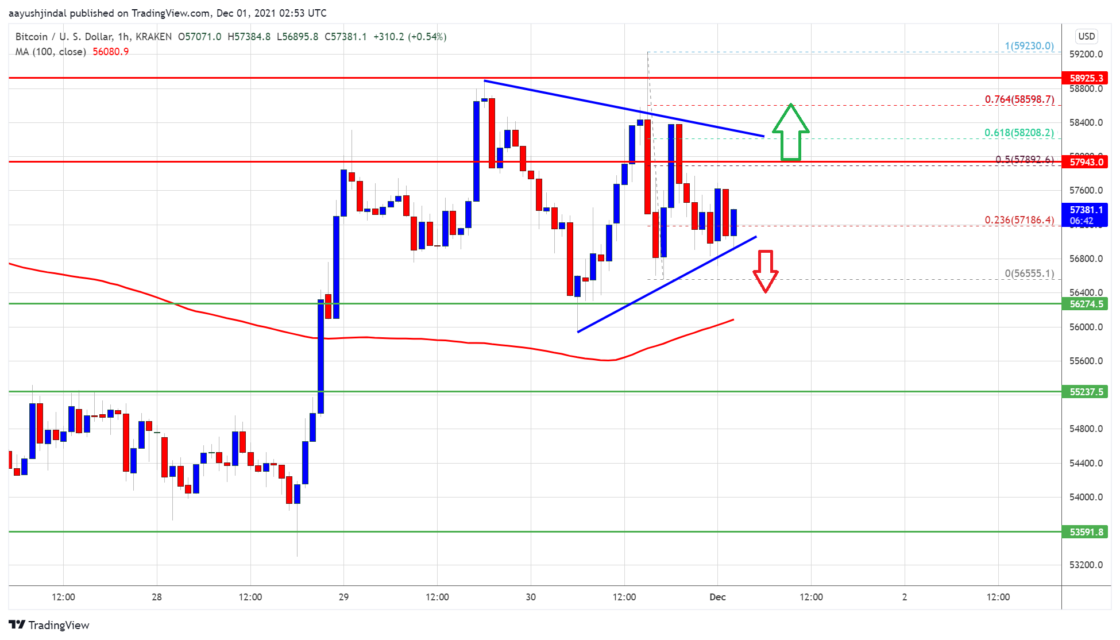
Analyst says a clear break above the $58,200 resistance zone could open the doors for more bullishness. According to him, the next key resistance is near the $58,500 level, above which the bulls could aim a test of $60,000. Any further gains could push the price towards $61,200.
Will Bitcoin Drop?
According to Jindal, if Bitcoin fails to break past the $58,500 resistance zone, it could start a fresh decline. An immediate support on the downside is near the $57,000 level. The first major support is currently forming near the $56.200 level and the 100 hourly SMA. A downside break below the $56.200 support could push the price towards $55,500. Any further losses could take the price to $55,000.
What Do Technical Indicators Say?
- Hourly MACD – The MACD is now losing momentum in the bearish zone.
- Hourly RSI (Relative Strength Index) – The RSI for BTC/USD is currently close to the 50 level.
- Main Support Levels – $57,000 followed by $56,200
- Main Resistance Levels – $58,000, $58,500 and $60,000


? Flare Token Price and Comment")

